Shelf planning and conversion results are displayed as planogram graphics, provided as reports or exported in standard formats.
Documentation and presentation of shelf planning targets different recipients:
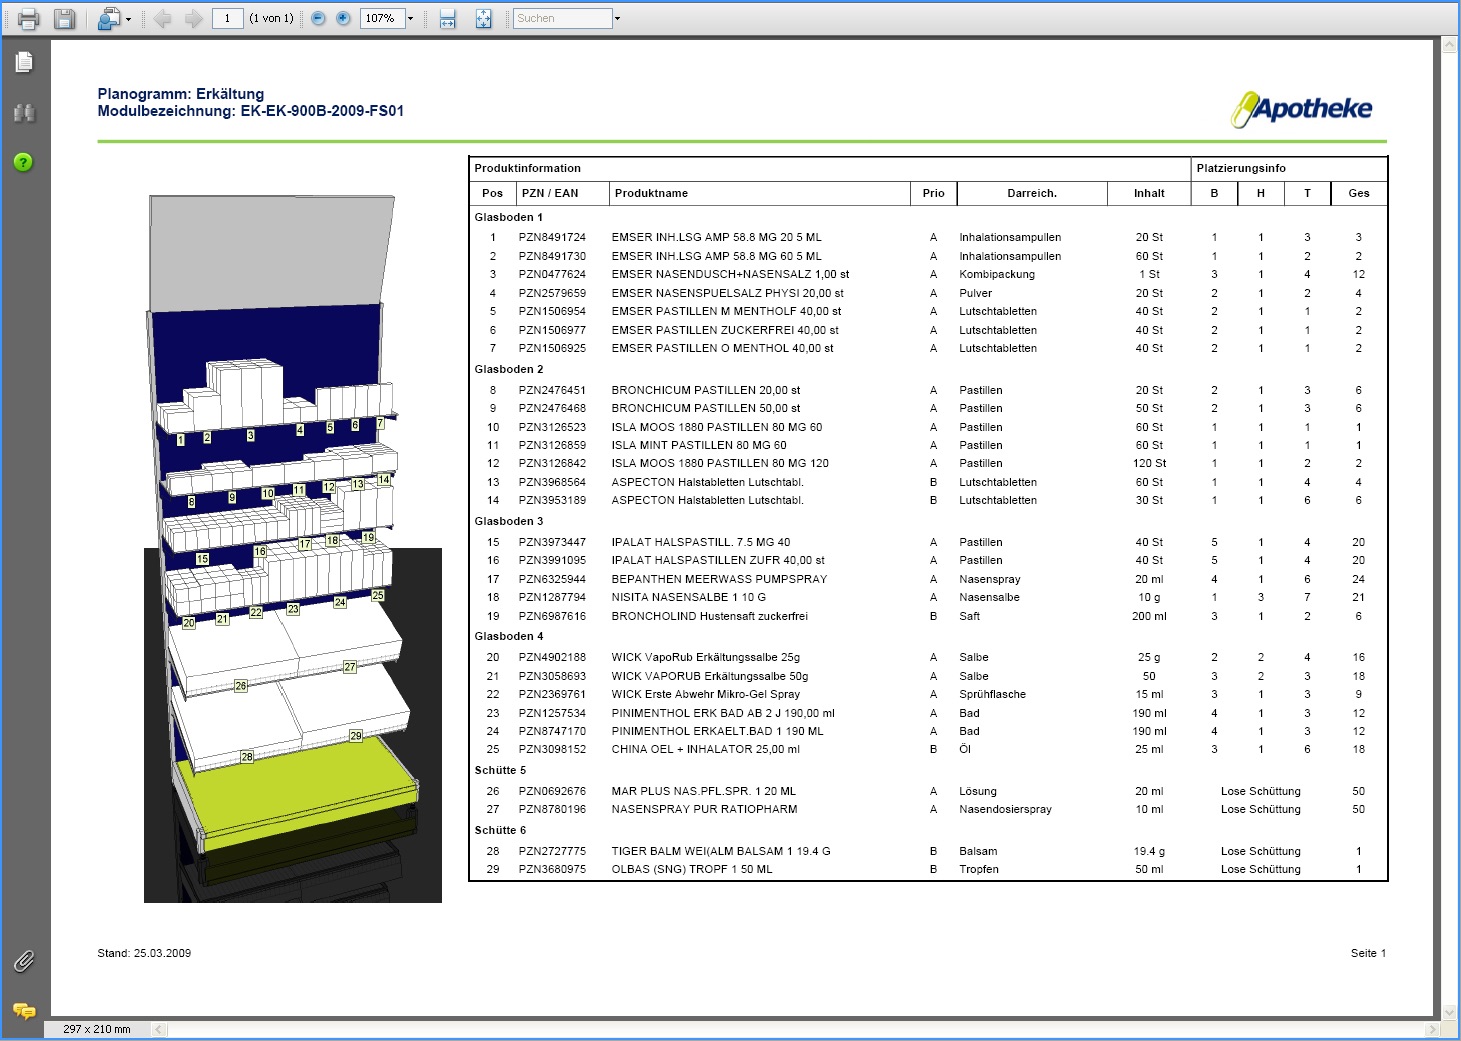
- The planogram of a shelf should be documented graphically and in tabular form for internal and external purposes.
- The allocation plan serves as the basis for equipping the fitters.
- The planogram is used in listing discussions with the trading partner.
- The planogram can save sample build-up costs.
- A franchise head office develops specifications for equipping the shelves for its franchise partners.
- Retailers archive their shelf stock and can compare the target setting with the actual situation.
- In the stores, the documented shelf equipment can be used for kiosk systems and digital, mobile customer guidance systems.
In addition, it is important to store the shelf plan in a stable way so that further developments can be derived from it later on, as well as having reliable success control in a before-and-after comparison.
[tabs] [tab title=”Presentation” disabled=”no” anchor=”” url=”” target=”blank” class=””]Presentation
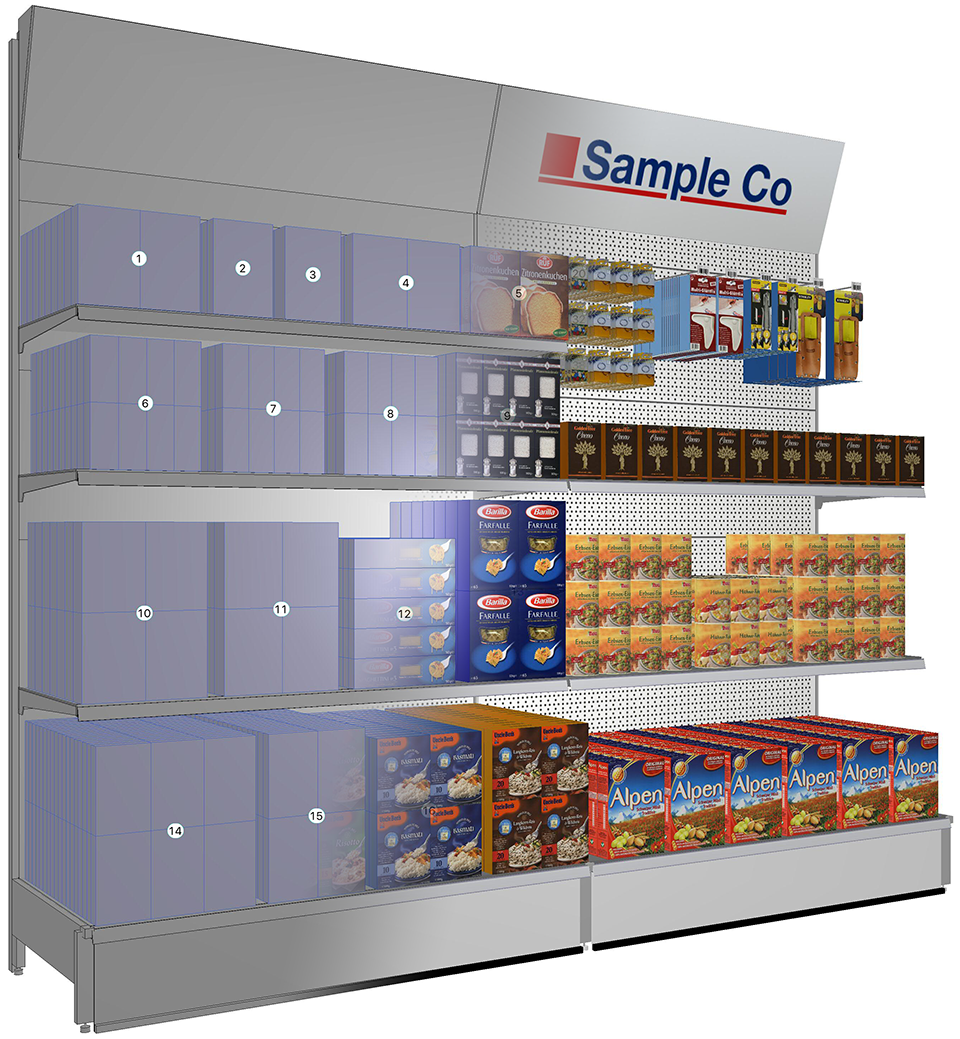
XPace provides many ways to optically prepare a graphical planogram for different purposes.
While the technically correct positioning and the quantities of articles are important for the rack jobber, the image display with position numbers is more interesting for listing discussions and virtual sample constructions. Franchise partners want precise positioning guidelines. For mobile customer guidance systems and information terminals however, the preparation of shelf data with identifiers and location information is essential.
XPace supports these display modes:
- 2D and 3D graphics
- with dimensions, position numbers and freely definable labels
- by image or surface representation
- as simple product boxes or complex three-dimensional models
- with metadata and calculated fields
Reporting
XPace reporting prepares planograms graphically and in tabular form for reports. The reports are provided with graphics, tables, logos and the metadata of the planogram project.
All product data is available for reporting. The images can also be output in reports. Barcodes can be generated and printed. The data of all fixtures, their parts lists and prices can be used in reports.
Reports are available in the formats
- Excel
- HTML
- XML
Extensions also allow output in PowerPoint and Word formats.