

In a planogramming project, certain steps are taken to create a qualified shelf plan that best meets the objectives of the project. XPace follows the 4Q strategy with four questions: What – How much – Where – Why and implements the planogramming functions in its methodology.
Any planogramming project is based on an idea and intention, taking a point-of-sale design into account. In the simplest case, the goal is to map a given product selection on a shelf and document the virtual shelf planning in the form of a planogram.
In an extended view, the values in the planogram can be made transparent with product and item data. This provides information on stock coverage and imminent stock shortfalls, as well as key figures on sales and profitability. Using these analyses, suggestions for adapting the equipment evolve. The planogram is the basis for subsequent restructuring, conversions, and performance reviews.
Define the Goals
In the first step, the planogramming project’s goals are defined. Objectives can be:
- Carry out shelf planning and report the allocations graphically and in list form.
- Save costs by reducing sample build-ups.
- Adapt a space allocation plan to a certain market size, a customer listing or an assortment, while increasing sales and earnings.
- Check the planned inventory and test for overstocking and understocking.
- Determine the value of goods, costs, turnover and return on a specific, customer-related shelf project.
- Try out and evaluate alternative space allocation designs, increase the area performance.
- Adapt an existing planogram to new requirements.
- Check the overall success of shelf planning activities.
The objectives affect the actual procedure in the subsequent steps.
Sample target definition
The shelf is to represent assortment S for customer X and market size class A. The planning needs documentation for the sales department, the customer and the rack jobbers; the documentation should contain suitable graphical representations as well as audience-specific lists and tables. The shelf plan shall be stored as a new version of an existing shelf.
XPace puts this into practice by creating a new planogram project and assigning an assortment, a customer and a market size class.
Determine an Assortment
Product selection for the rack assembly results from the objectives given. Product selection is the What question: which products should be positioned on a specific shelf? Product selection in XPace is done
- as manual search with individual or grouped selection
- by loading an external listing table
- or as a query on the database using rules with criteria
However, when picking up the actual state of a shelf in a store or sample room, the selection is already fixed; the articles actually found on the shelf are read in with a barcode scanner.
Criteria-based query example
Give items in the HAND TOOL category that generated turnover of at least € 1,000 in the previous quarterly period. Limit the selection to the 12 products with the highest sales, which are assigned to market size class A.
The product selection creates virtual shopping baskets, representing the assortment for the shelf. In a subsequent step, these shopping baskets are placed on the product carriers on the shelf.
Build a Rack
But first, the rack itself, with its fixtures, holders and displays needs to be assembled. The XPace Component Library provides all components for virtual shelf construction. It contains the most frequently used standard parts and can be extended for special fixtures and displays.
 Grids and anchor points as well as functions for copying and moving product carriers and shelf segments enable the shelf to be set up quickly. Shelves and baskets can be positioned precisely to a grid. In addition to simple wall racks, gondolas, pallets, and lattice boxes as well as heavy duty racks can also be set up. Custom displays and stands can be integrated. Product carriers are either regarded as individual or linked objects.
Pegboard hooks do not have to be set individually. They are automatically used together with hanging goods due to a selectable standard hook; the product position is determined by the position of the product block of the hung article.
Typical shelf arrangements can be created in XPace from predefined scenarios. By specifying a few size parameters, a basic shelf configuration can be obtained quickly.
Example: planogram construction using a scenery
After selecting the “Gondola” basic configuration, the element width “1.25 m”, the height “2.10 m” and the number of elements, a complete central room rack unit with all necessary parts is created: Pedestals, columns, pegboards, consoles, shelves and head panels.
Other shelves, baskets and holders can be added as required. The illustration of the head panels is done individually by dragging suitable images onto the panels using the mouse.
The components are realistically designed and provided with logistical identifiers and bills of materials, so they can be used for carrier reporting of the planogram.
Place Products
Products are placed in the rack by dragging them individually or as an assortment shopping basket onto a product carrier. The products are arranged and aligned by XPace on the product-carrying fixture.
Determining the position of the product is the Where question: The product carrier specifies available positions and rotations, the article brings its own rules for positions and distances, the articles already on the product carrier occupy their own part of the space. The positioning procedure takes into account:
- grids
- already positioned articles
- rotations
- hooks and other holders to be inserted
- stacking limits and handling gaps between the articles
- additional space required due to weight-related deflection of hooks and fixtures
- alignment and distribution options
- the continuation of allocation on a linked fixture
XPace distinguishes between the three assembly types hanging, upright/stacked and loosely piled and excludes any incompatible, incorrect assembly. XPace automatically finds a suitable position on the fixture, applies a rotation if requested and ensures the implementation of the assembly in real-world rack jobbing. Pegboard hooks are set automatically. The assignment of shopping baskets to product carriers can be automated with rules.
The proposal algorithm finds suitable articles for a fixture. The refill function makes the products best fitting the available room. Barcode scanning finds items by scanning their barcode.
Position determination example
Place the three articles X, Y and Z next to each other on hooks in a pegboard panel in the first segment of the shelf. Use a standard hook. Observe the peghole grid and the hook hole of the articles. Keep a minimum gap between the articles.
The formation of assembly blocks is the How much question: How large should and can an assembly block be for an article, how many units should it contain?
The algorithms used here take into account the shape and size of the articles, the assembly space of the fixture and the expected sales figures:
- size of the placement block
- assembly area limits of the fixture
- limitation by a desired filling level
- packing units
- sale forecast
In addition to the article size, stock objectives and the delivery frequency for the rack are taken into account here.
Stock quantity determination example
Use the specified minimum stock quantity, while rounding to the next packaging unit. Observe the product carrier’s filling level. Consider a stock surplus of 120% in order to avoid short selling during the delivery period.
All items, quantities and sizes can be post-processed manually. All articles can be moved freely on the product carriers, supported by alignment guides. On pegboards, the articles move with their hooks with grid accuracy.
Evaluate
The evaluation of positioned articles is the Why question: it is important for internal and external communication to be assured about the reason why exactly these articles are positioned in exactly this quantity at exactly these places and sizes. XPace’s scoring procedure works
- by determining standard prices or customer-specific prices
- by importing performance data such as sales and turnover figures from external sources
- by creating key performance indicators for individual products and product groups
- by calculating analyses
- and the color highlighting of the shelf based on the scoring values
 Key performance indicators are applied at article level or on a grouping (category, brand, manufacturer…).
The scoring results can be used internally to control the success of shelf planning and to optimize shelf allocation. They can also be used in external argumentation, in listing discussions with the customer and in discussions with external partners.
Example of profitability scoring
Mark the five top-selling items on the shelf in green and the five weakest items in red. Provide removals and additions. Regard the shelf space productivity.
Document
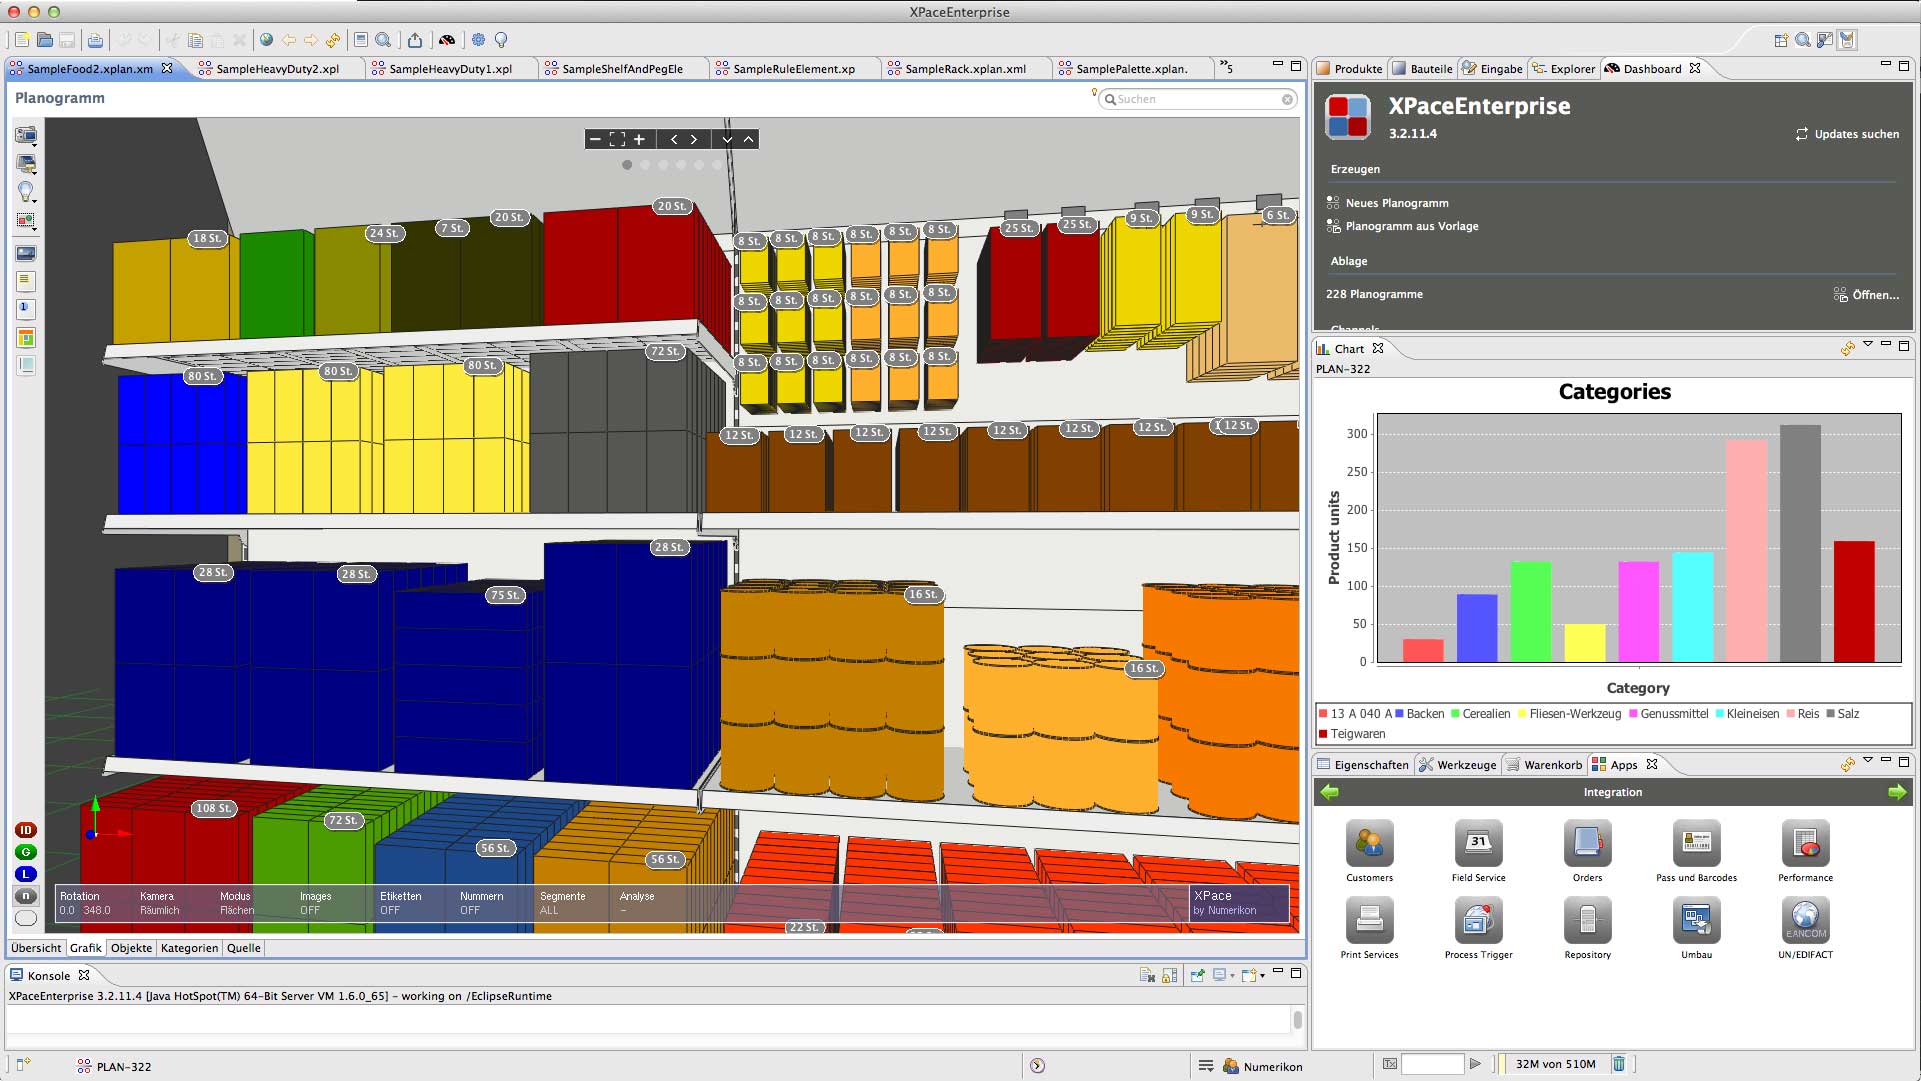
The planning and valuation results of a planogram are documented by reporting. Since an XPace planogram contains all data of the products, the product carriers and the items, the documentation can access this data and generate graphical and listed outputs. The presentation is audience-specific (sales, marketing, rack jobbers, customers…) and can be configured individually.
Important documentation features are
- creating various 3D and 2D views of the shelf
- displaying images and textures
- individual colouring
- free or programmatically controlled allocation of position numbers
- freely formatted output of all data fields as labels, even with calculated fields
- output of legends in colour lighting
- generating lists and tables from all data fields carried along
- synchronizing between graphics and lists
 Output is generated as graphics, Excel sheets, as a layouted report, as a web page or in another, individual format. The outputs are provided
- as graphics in standard formats
- as PDF reports
- as Excel worksheets
- by mail
- as publication on a web server
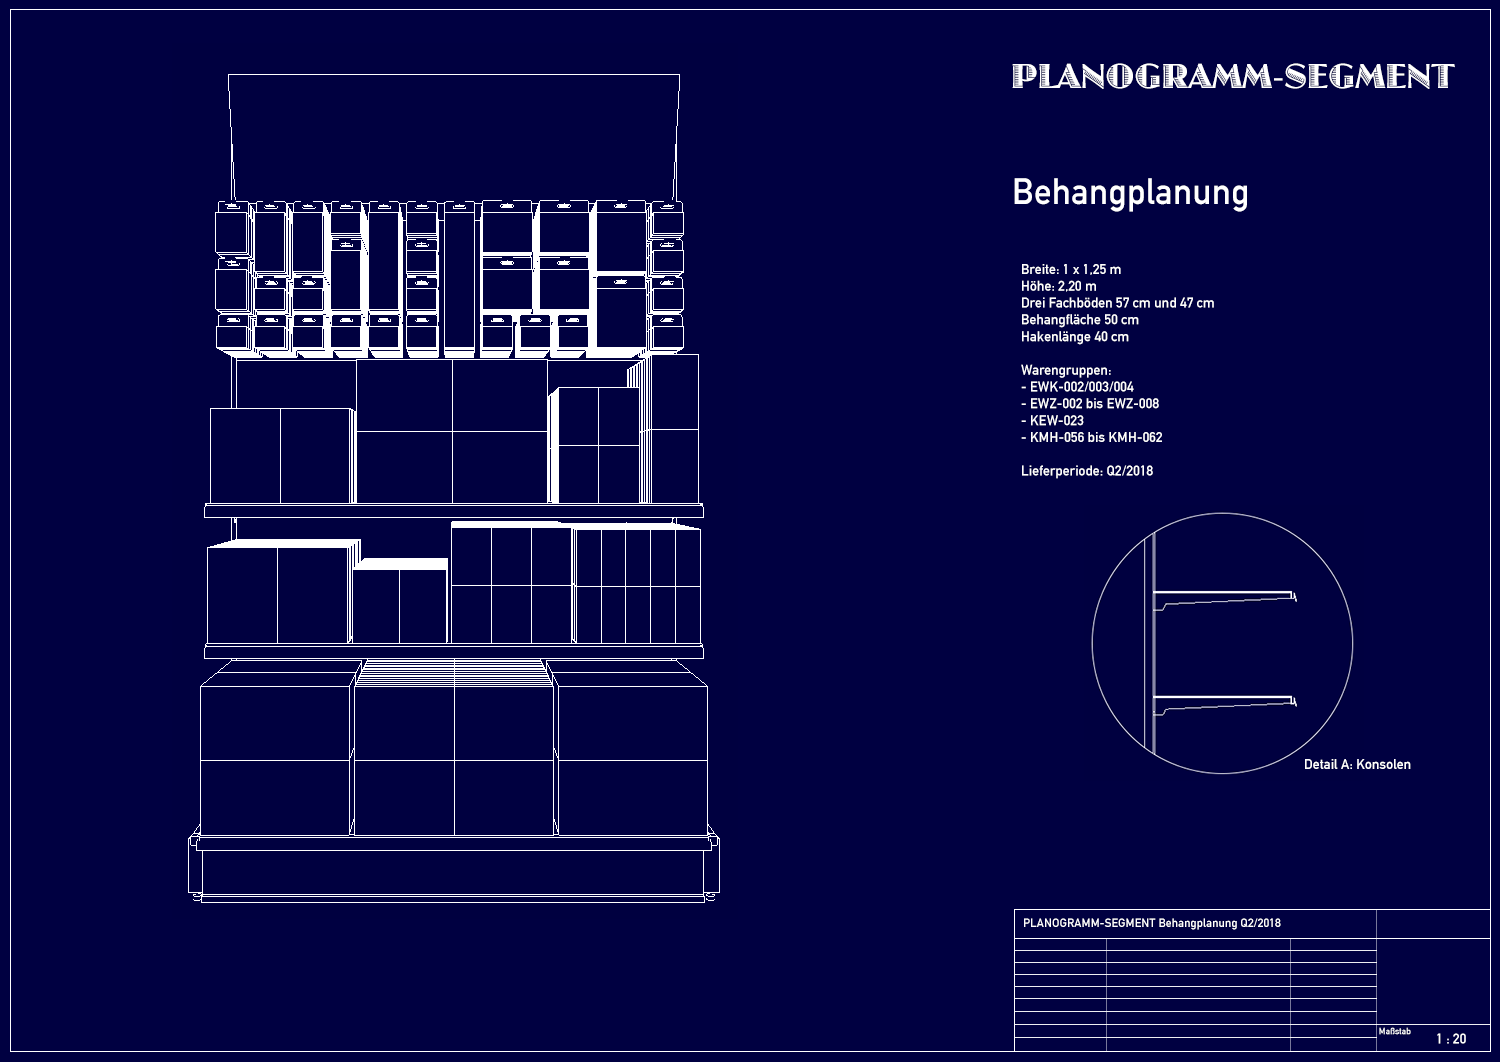
Documentation example
Create a report with a title page, planogram graphics for an overview, with a combined graphic/list display of the items and products of each shelf segment and a parts list of the product carriers used.
Demo articles and sales merchandise are to be displayed separately. The product carriers are to be divided into “provided by outlet” and “delivered individually”. The total costs for the rack structure should be visible.
The report should be suitable as assembly instructions for the rack jobbers, it should document the rack design committed with the outlet or customer as well.
Restructure
Shelf space allocation gets periodically adapted to new requirements and customer expectations. Because XPace shelf planning is stored in a repository, new shelves can easily be derived from existing shelves. By comparing old with new planograms, conversion instructions can be generated automatically.
Restructuring methods supported by XPace:
- Replace article X with Y in the current planogram
- Swap positions of X and Y
- Transfer products or product groups from one planogram to another via the clipboard
- Adjust the placement quantities in the planogram with a rule and based on a given data list
- Search in all planograms for article X
- Replace article X with Y in all planograms
- Replace the articles X, Y, Z…. in all planograms with the articles A, B, C… using a replacement list
- Delete article X in all planograms
For a general resizing, a cluster analysis is performed in XPace. The articles are grouped on the shelf according to certain criteria and ranked by group (cluster). To reduce the size of the shelves, the most dispensable articles in the cluster are removed and the remaining articles are rearranged. Supplementary articles for the clusters are proposed for enlargement.
Conversion control example
Article X is discontinued and replaced by Y. Find all active planograms containing X. Create a new version and replace X with Y. Update all reports and create conversion instructions.
Existing planograms must not be changed, updates only affect the new versions. Version comparisons show the changes.
Controlling
XPace applies versioning to manage several variants of the same planogram. With this historization, previous variants are kept stable and can be used for before-and-after comparisons. A time series comparison of two or more versions of a planogram shows the success of the planning measures carried out.
Success control example
Watch at the current planogram and its previous versions of the last three quarterly periods. Show the changes in the versions and the changes in the profitability of the sales area. Show the change in stock coverage and the avoidance of out-of-stock situations.
Integration
Planogramming data is not only important for shelf design, but also has an impact elsewhere in the company. XPace integrators can be used to trigger special exports and follow-up processes in the company. The processes can be triggered manually or automatically.
Sample integrator
A planogram shall be released after completion. The release trigger provokes notifications to configured recipients and automatically generates and updates all required reports.
The interface to merchandise resource planning triggers orders: for picking the required goods and the goods carriers to be delivered.
In label printing, the required guide cards are requested in the appropriate quantity and in the order of hanging.