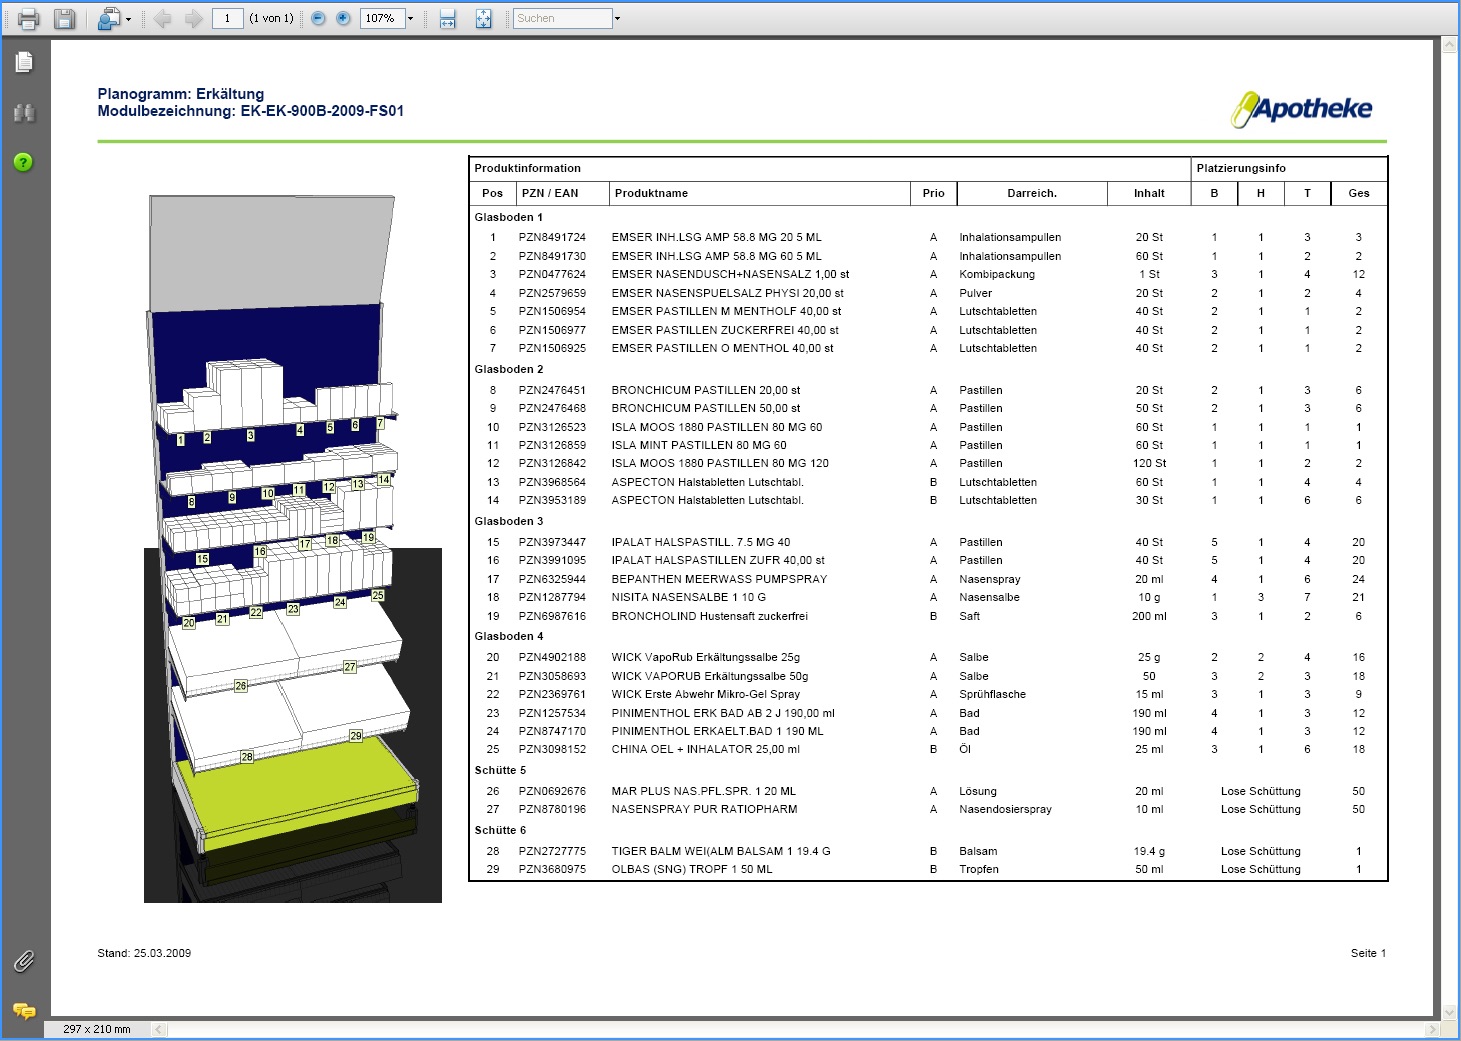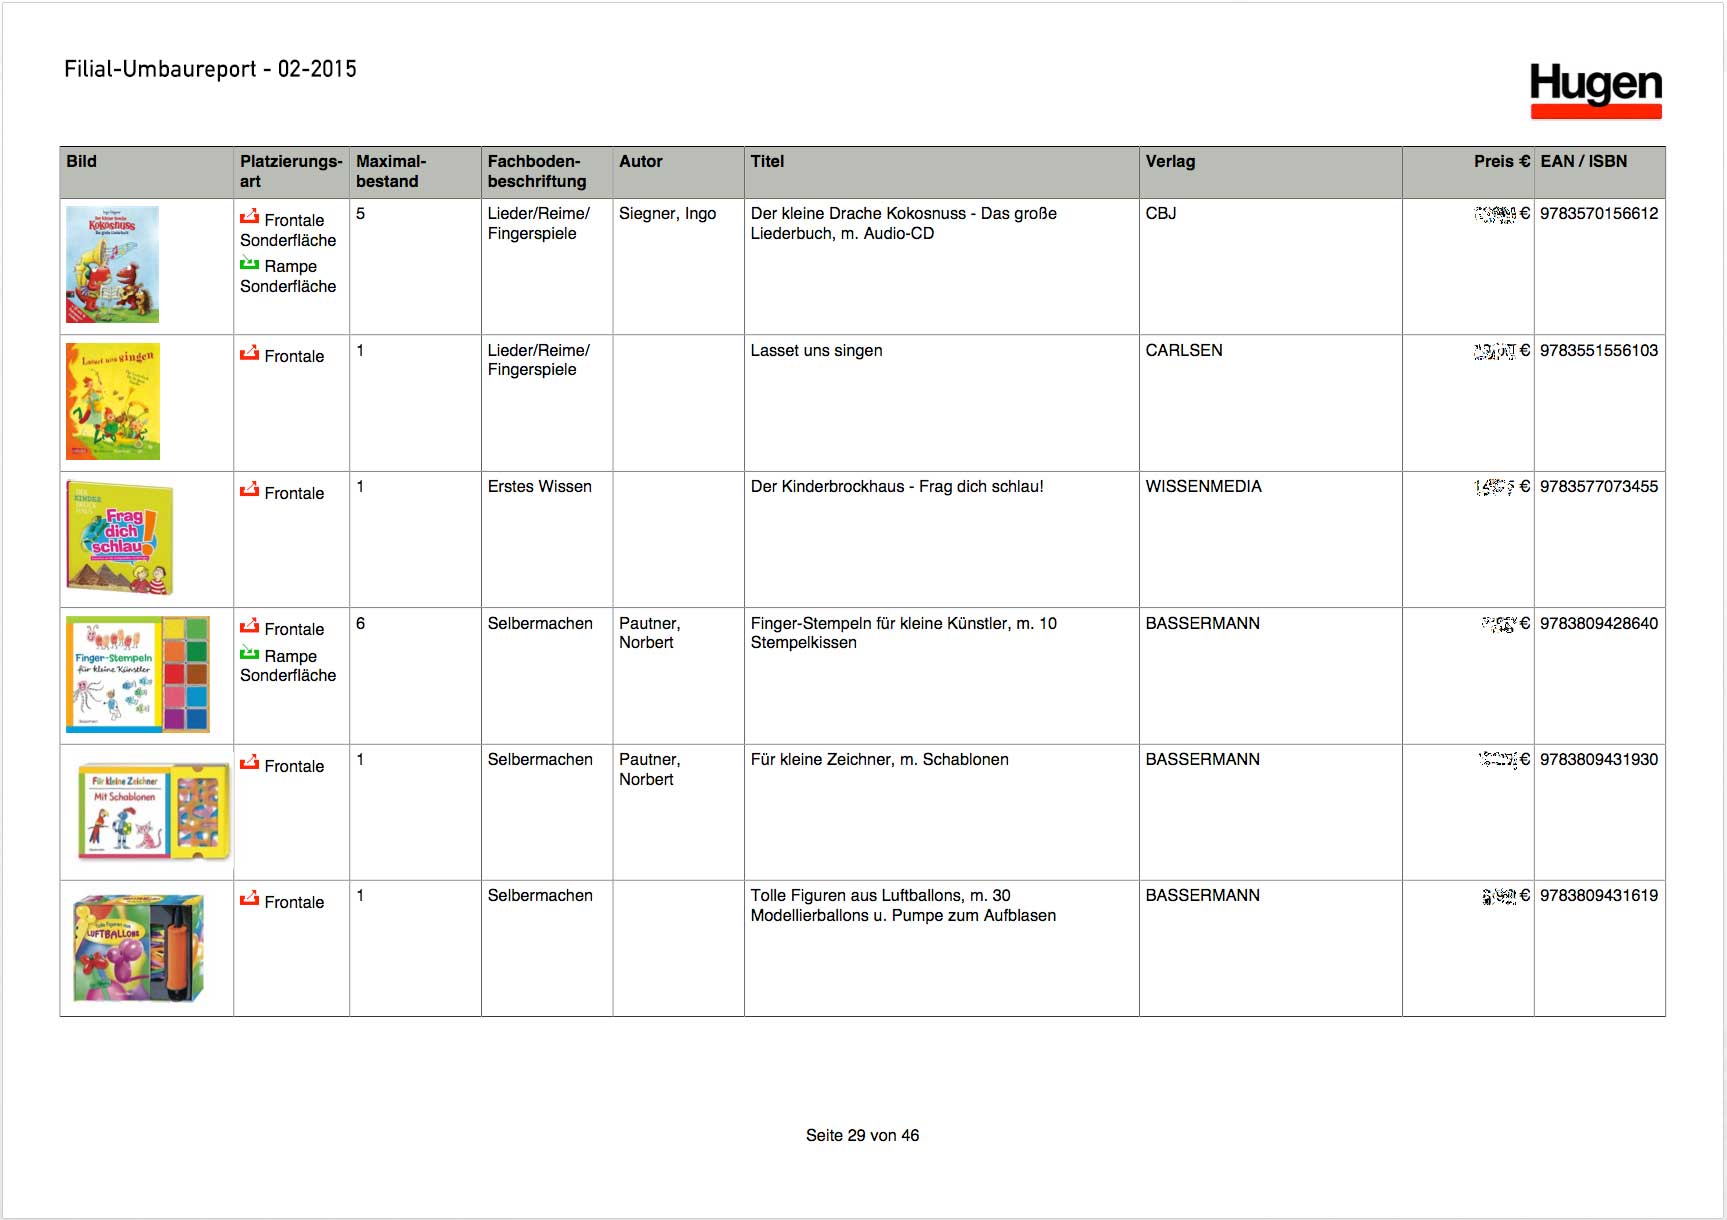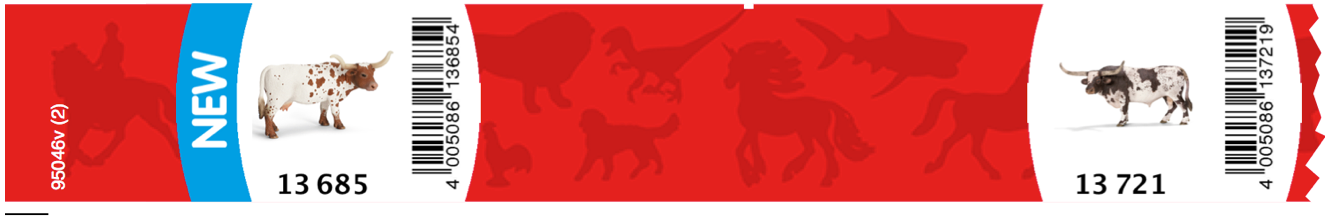

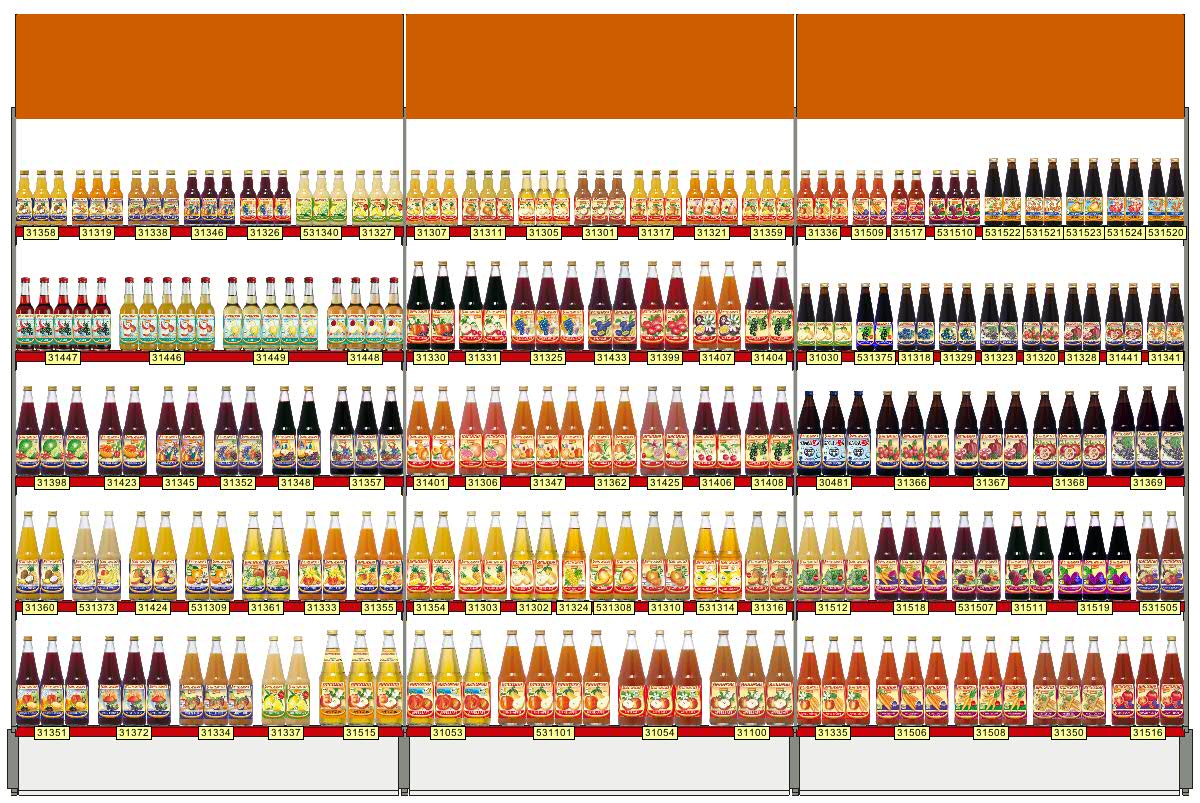
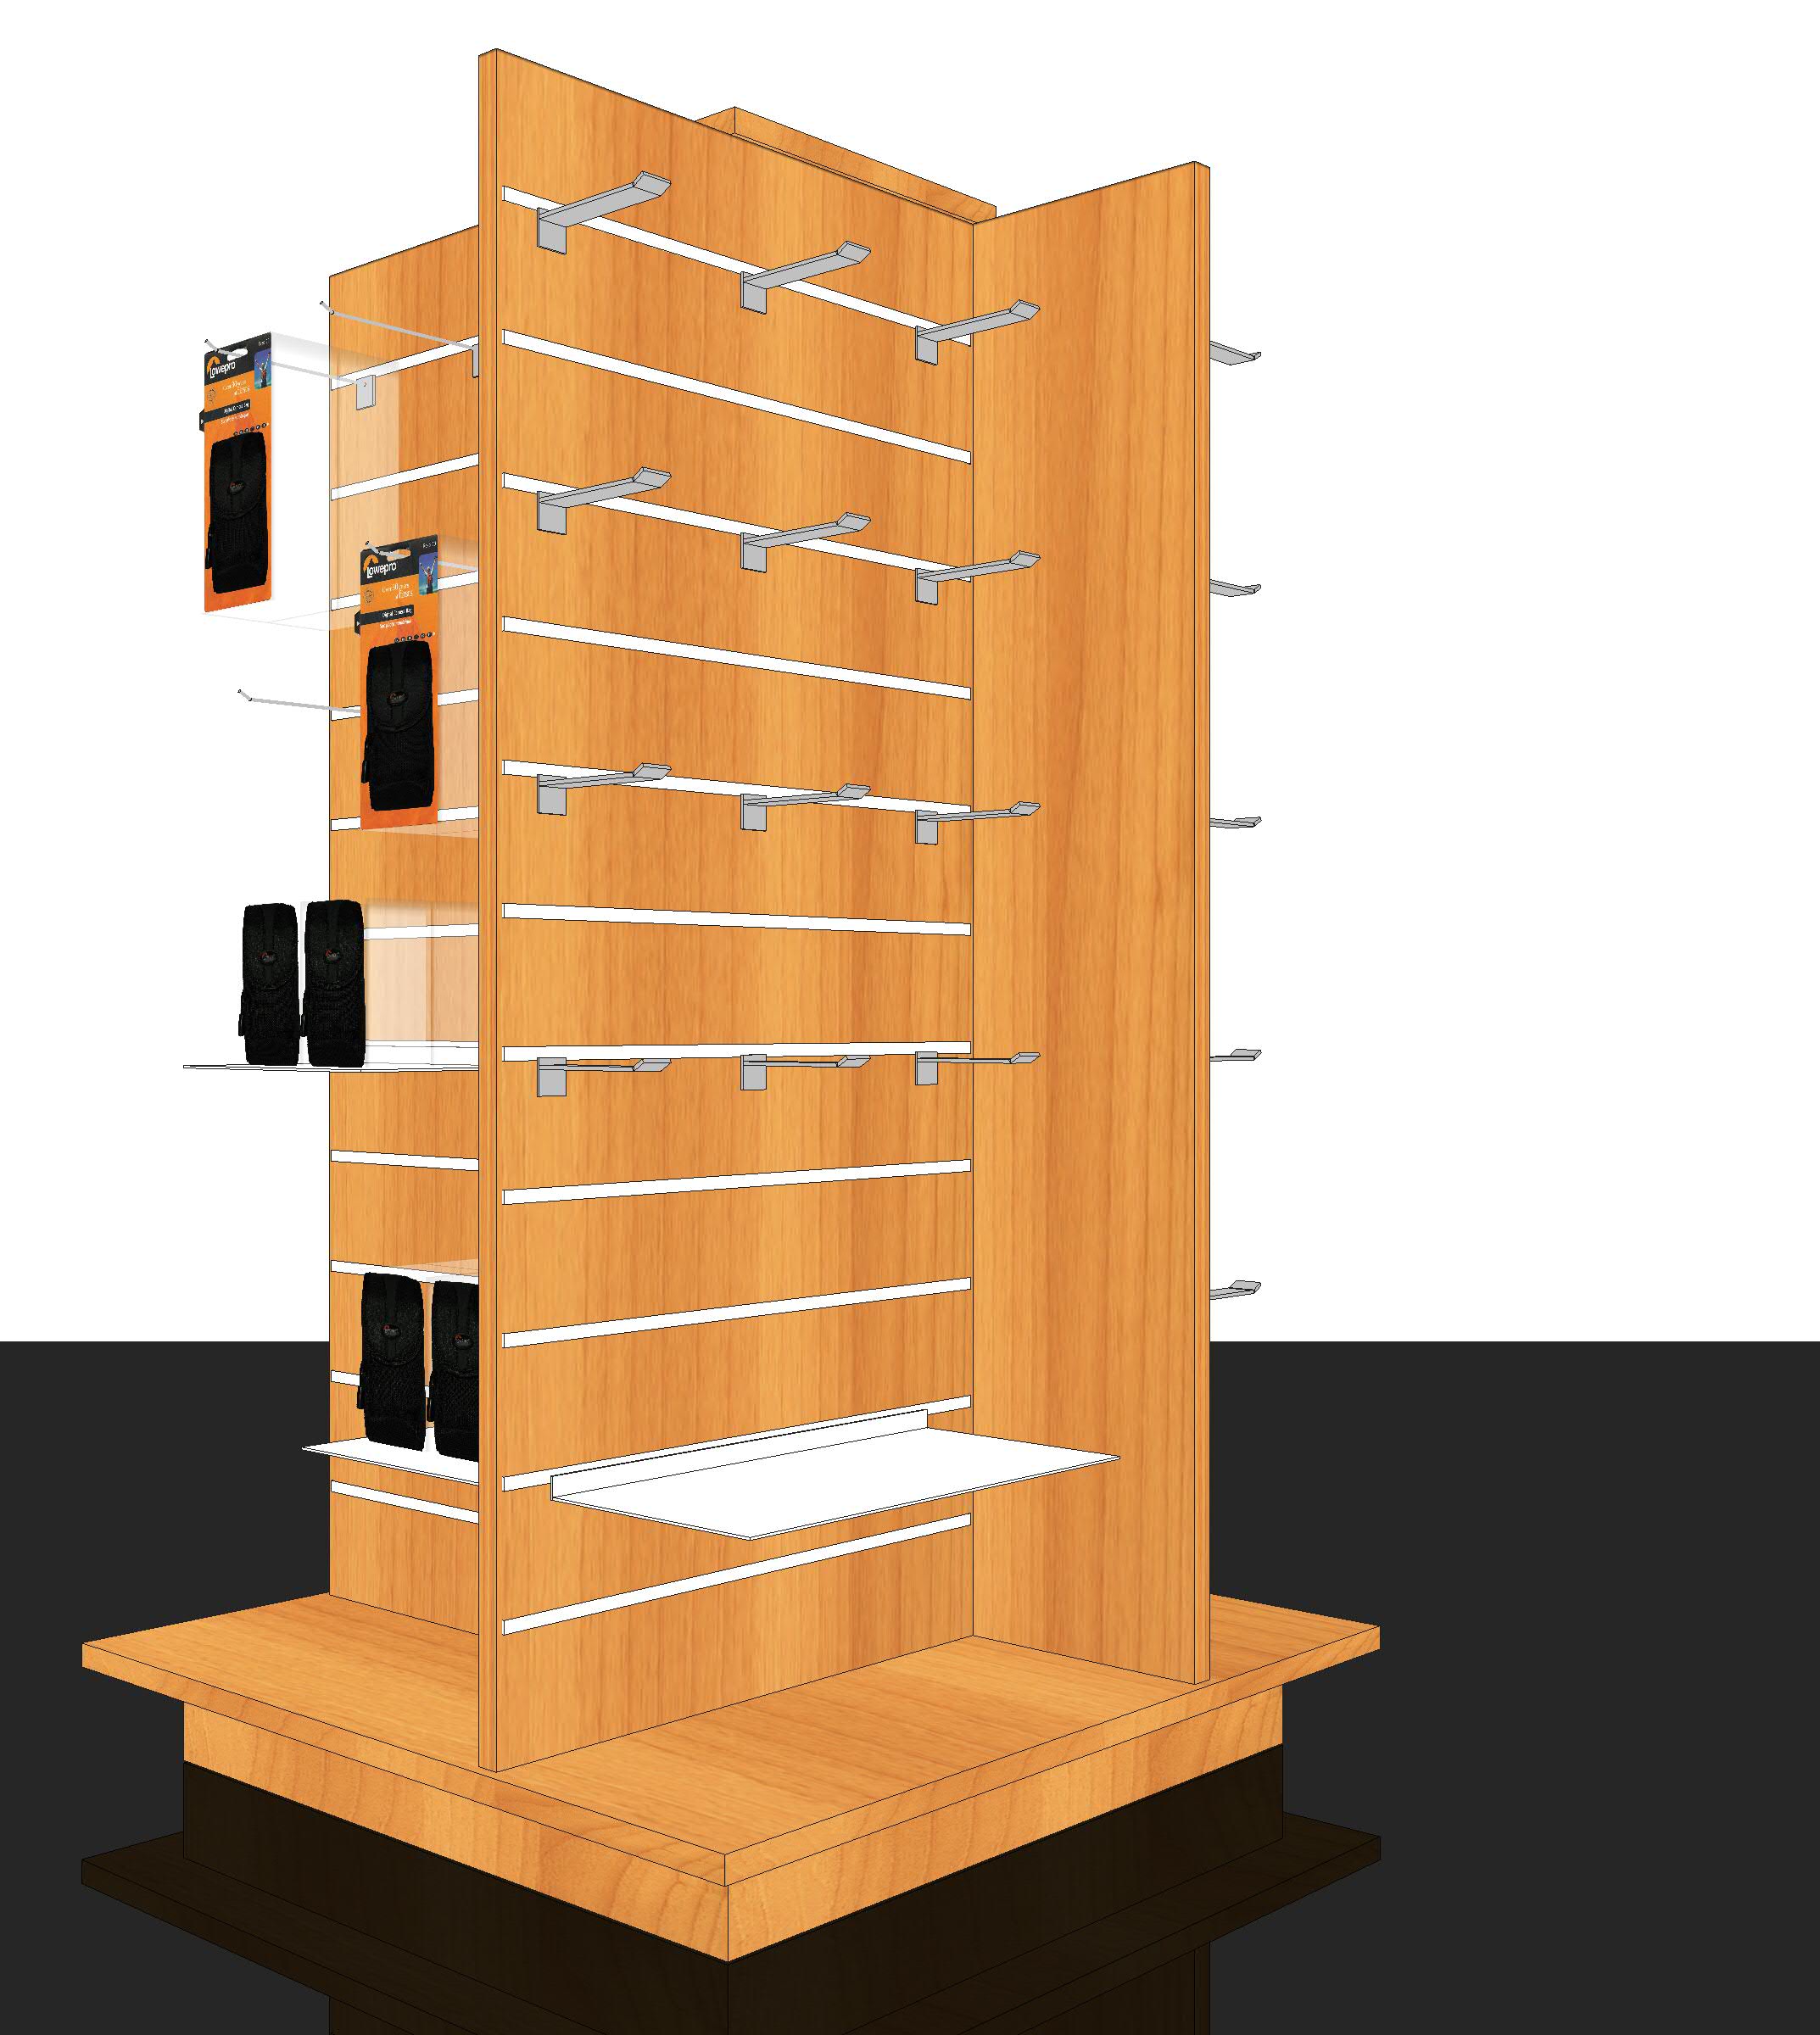
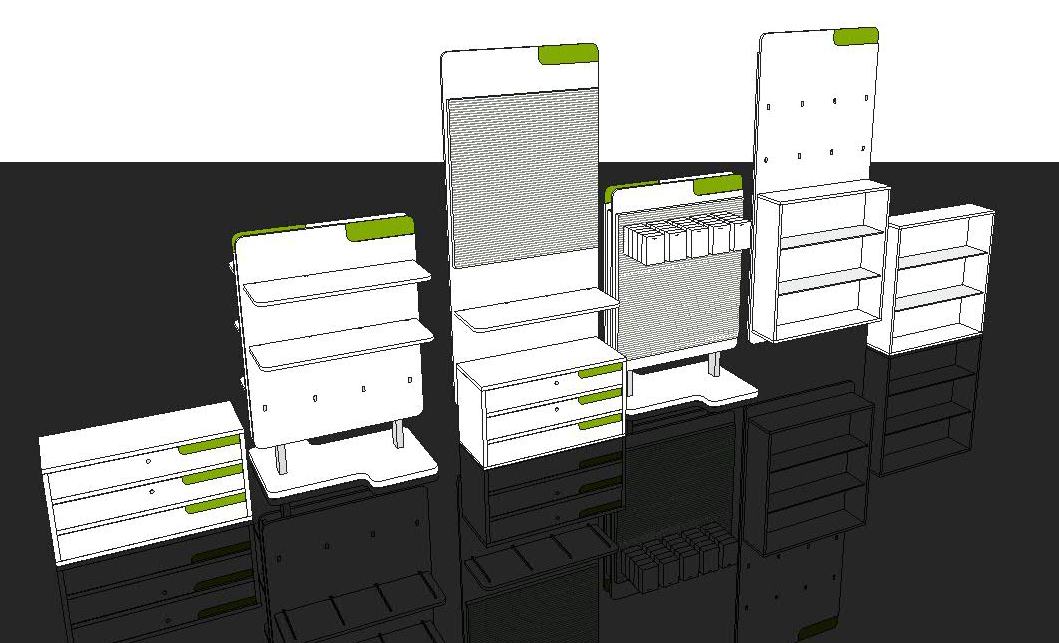
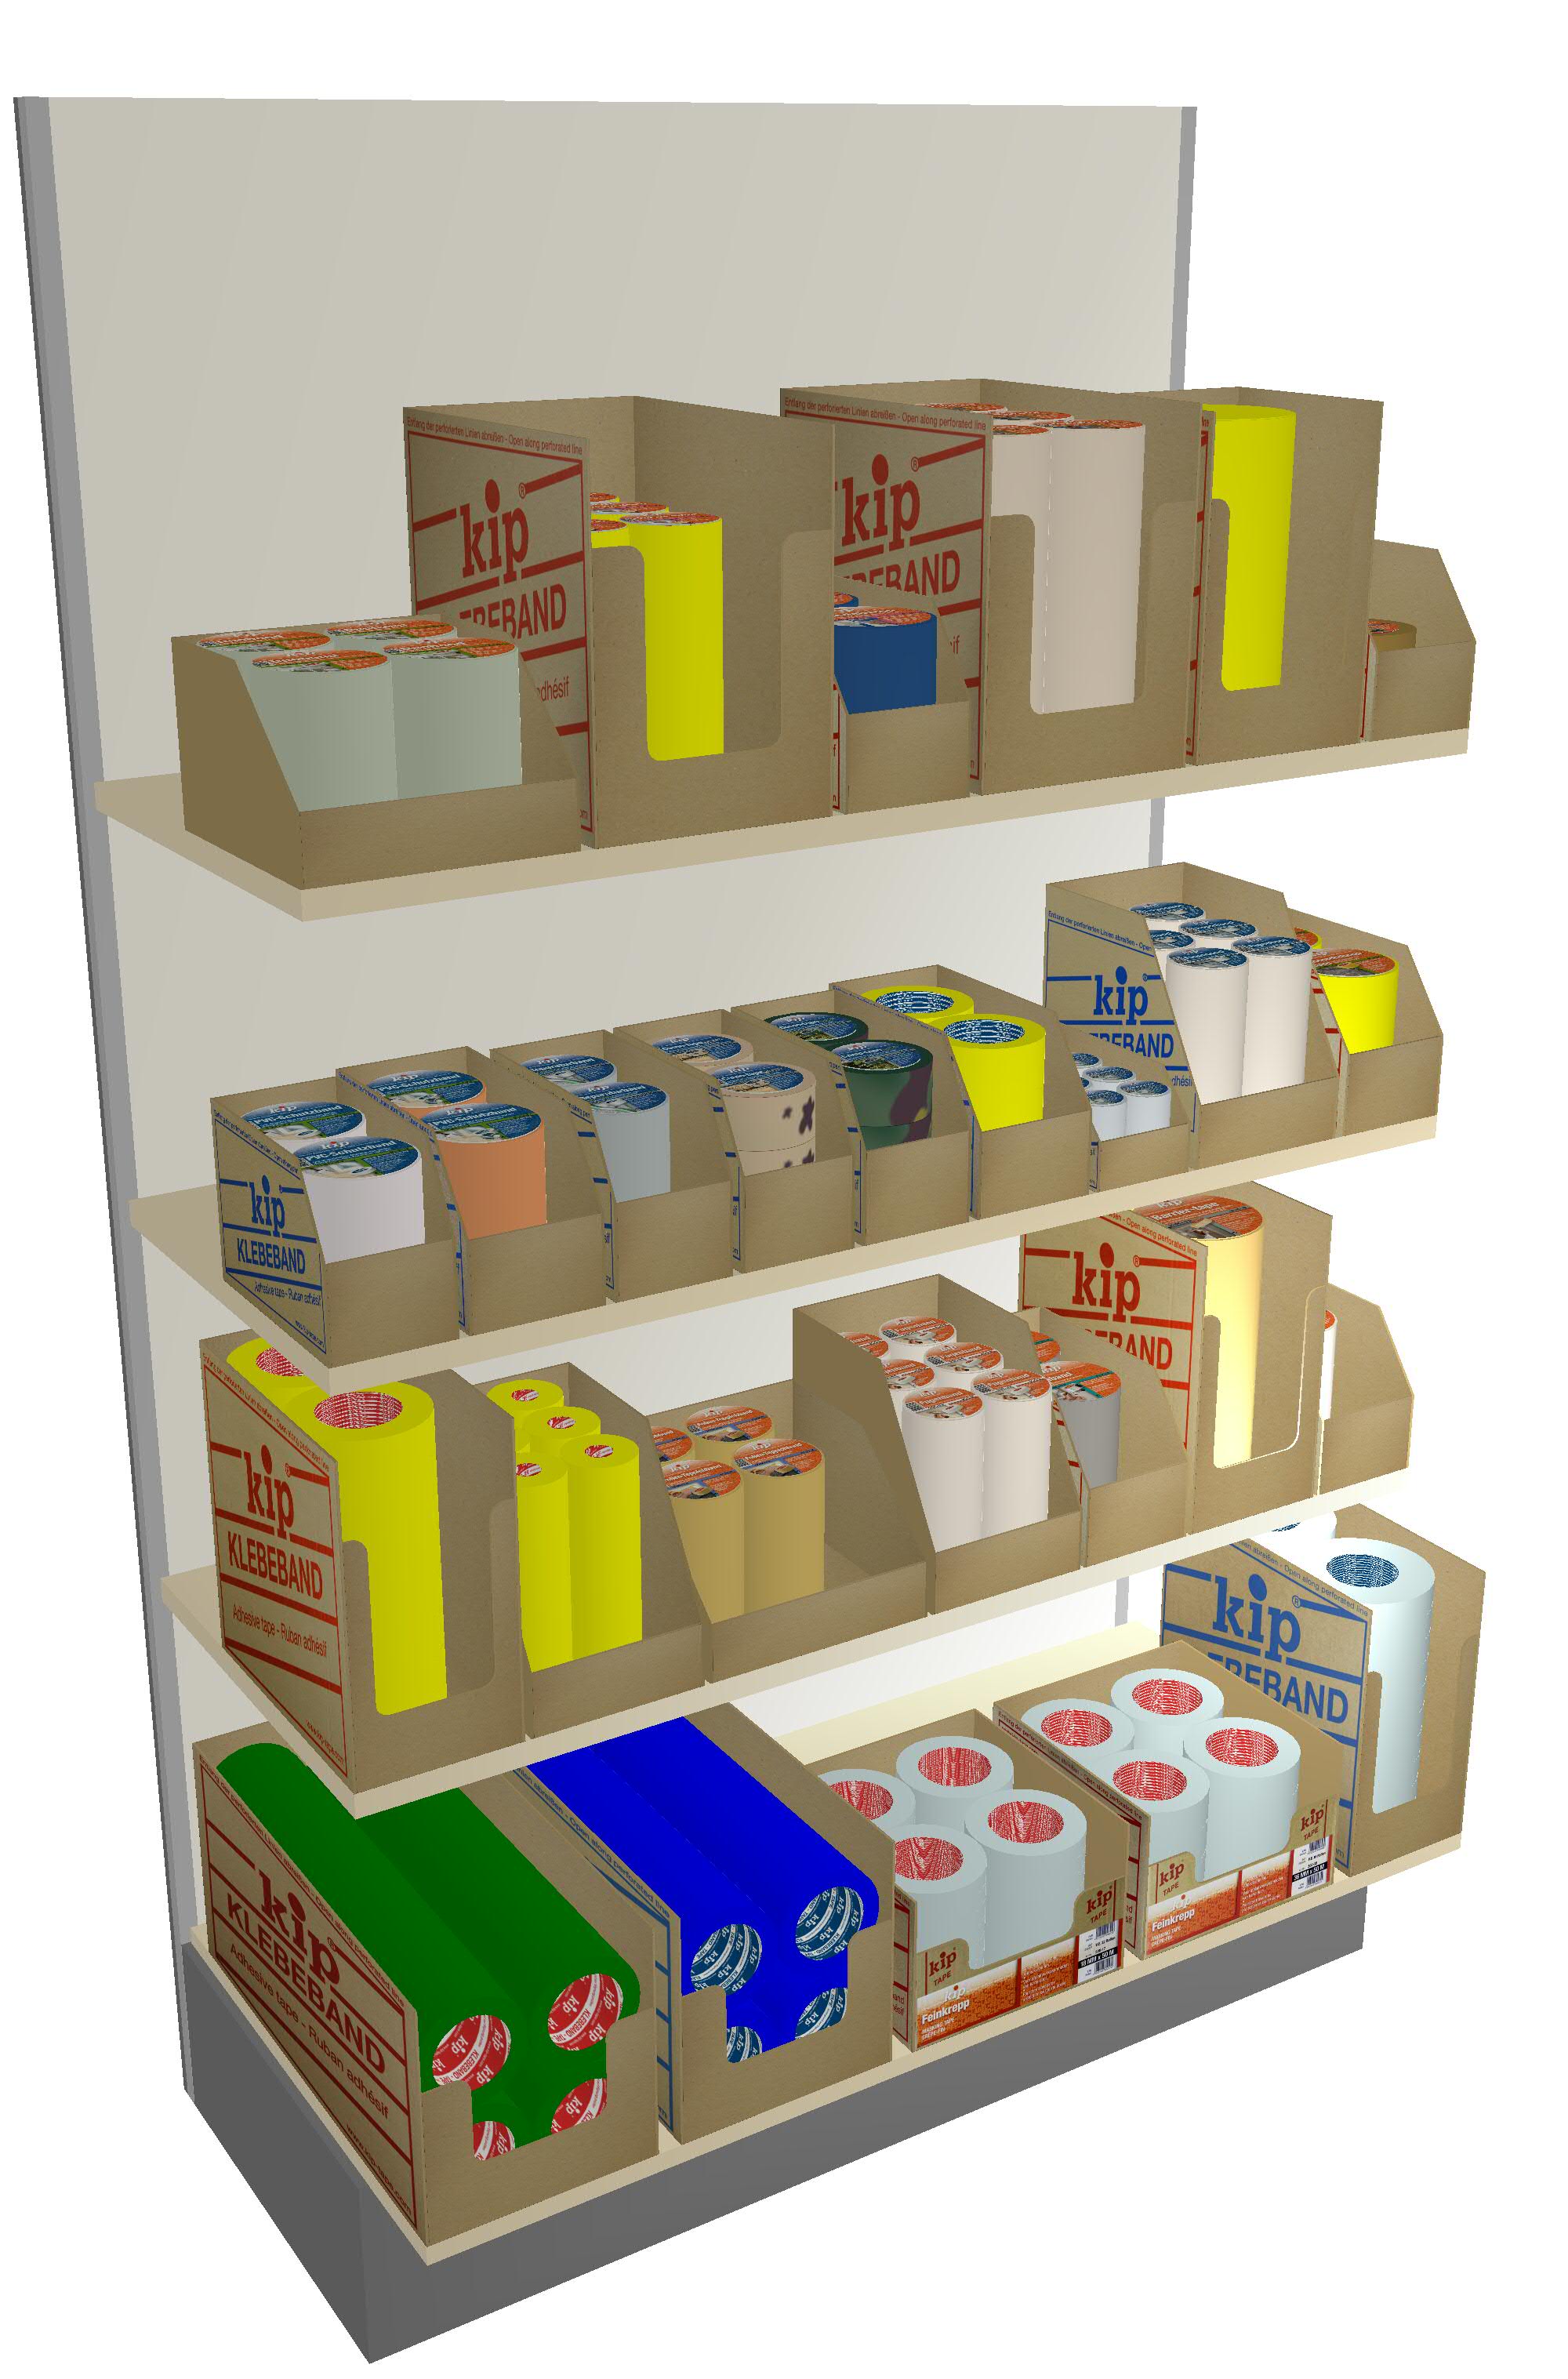
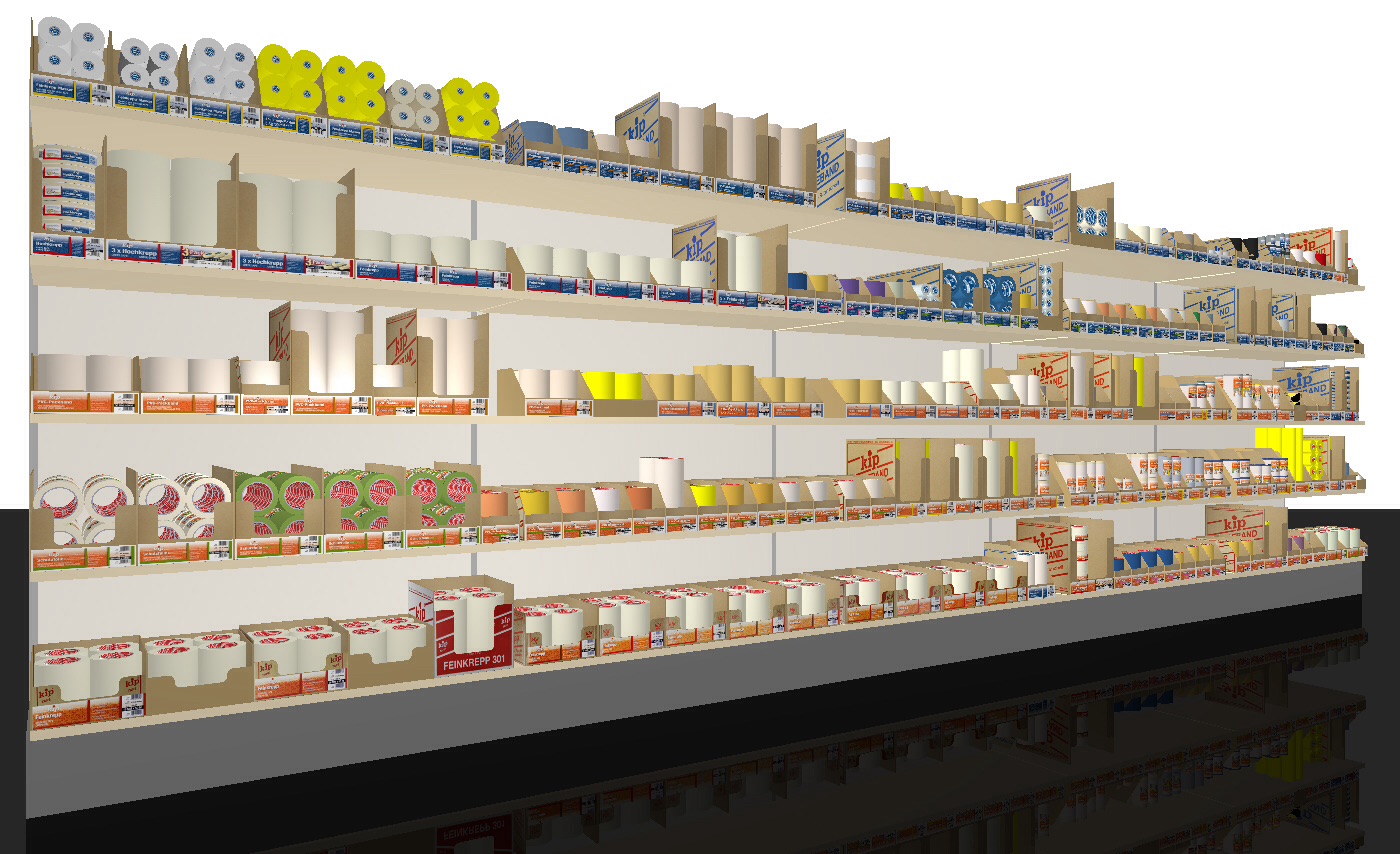
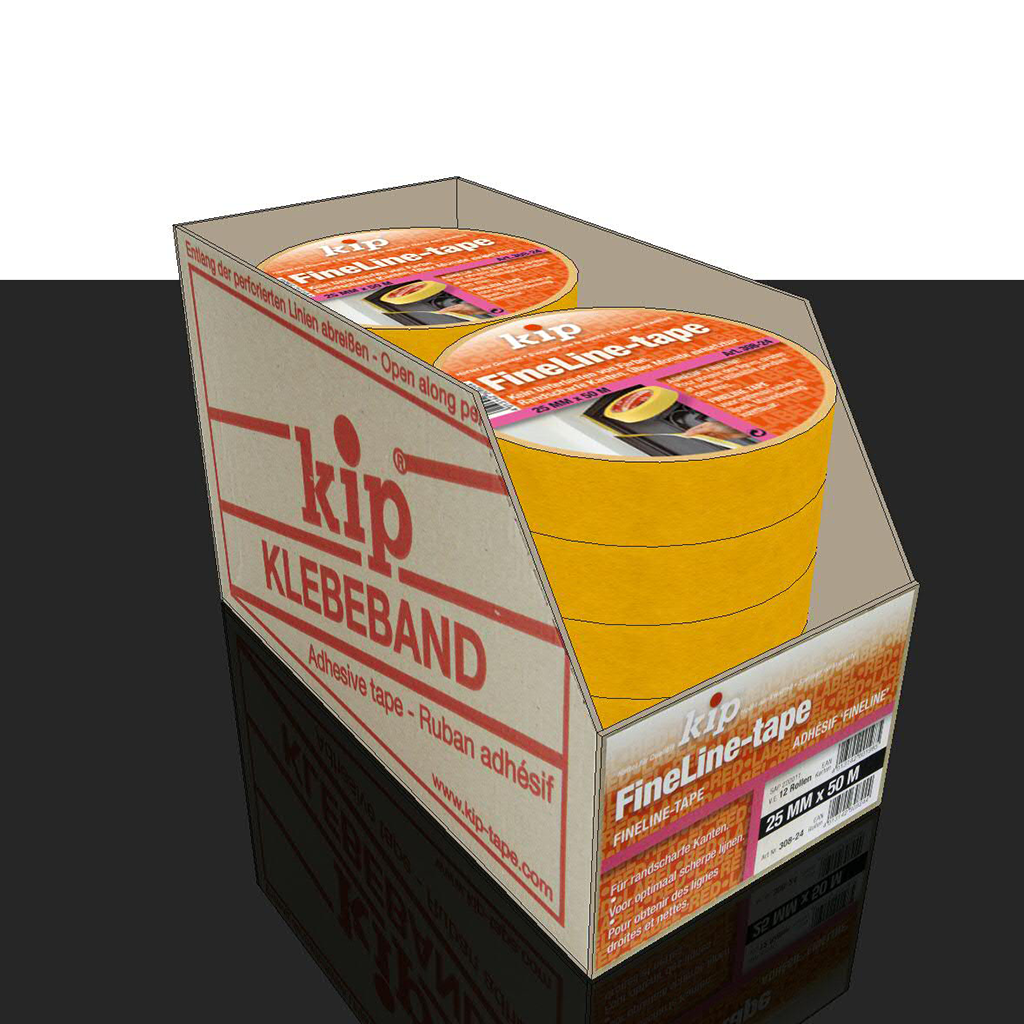
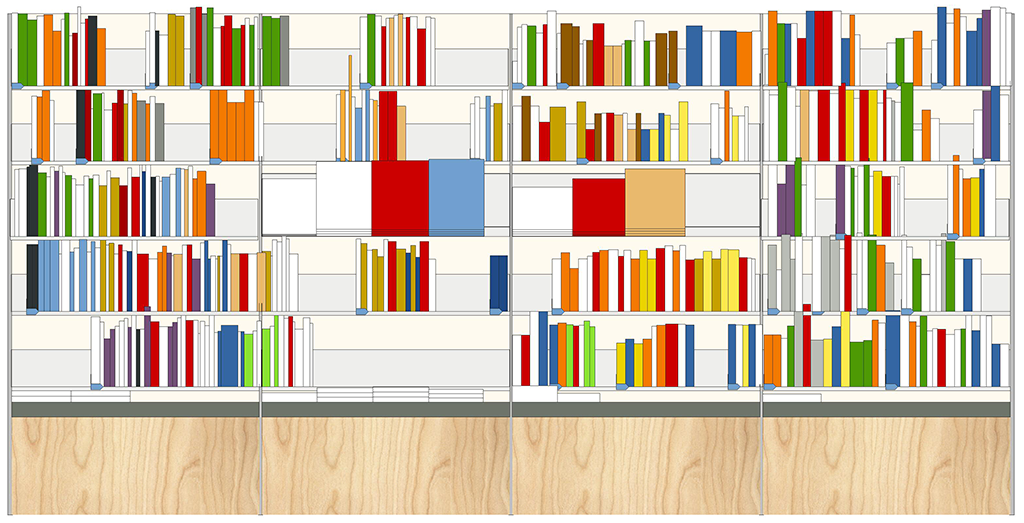
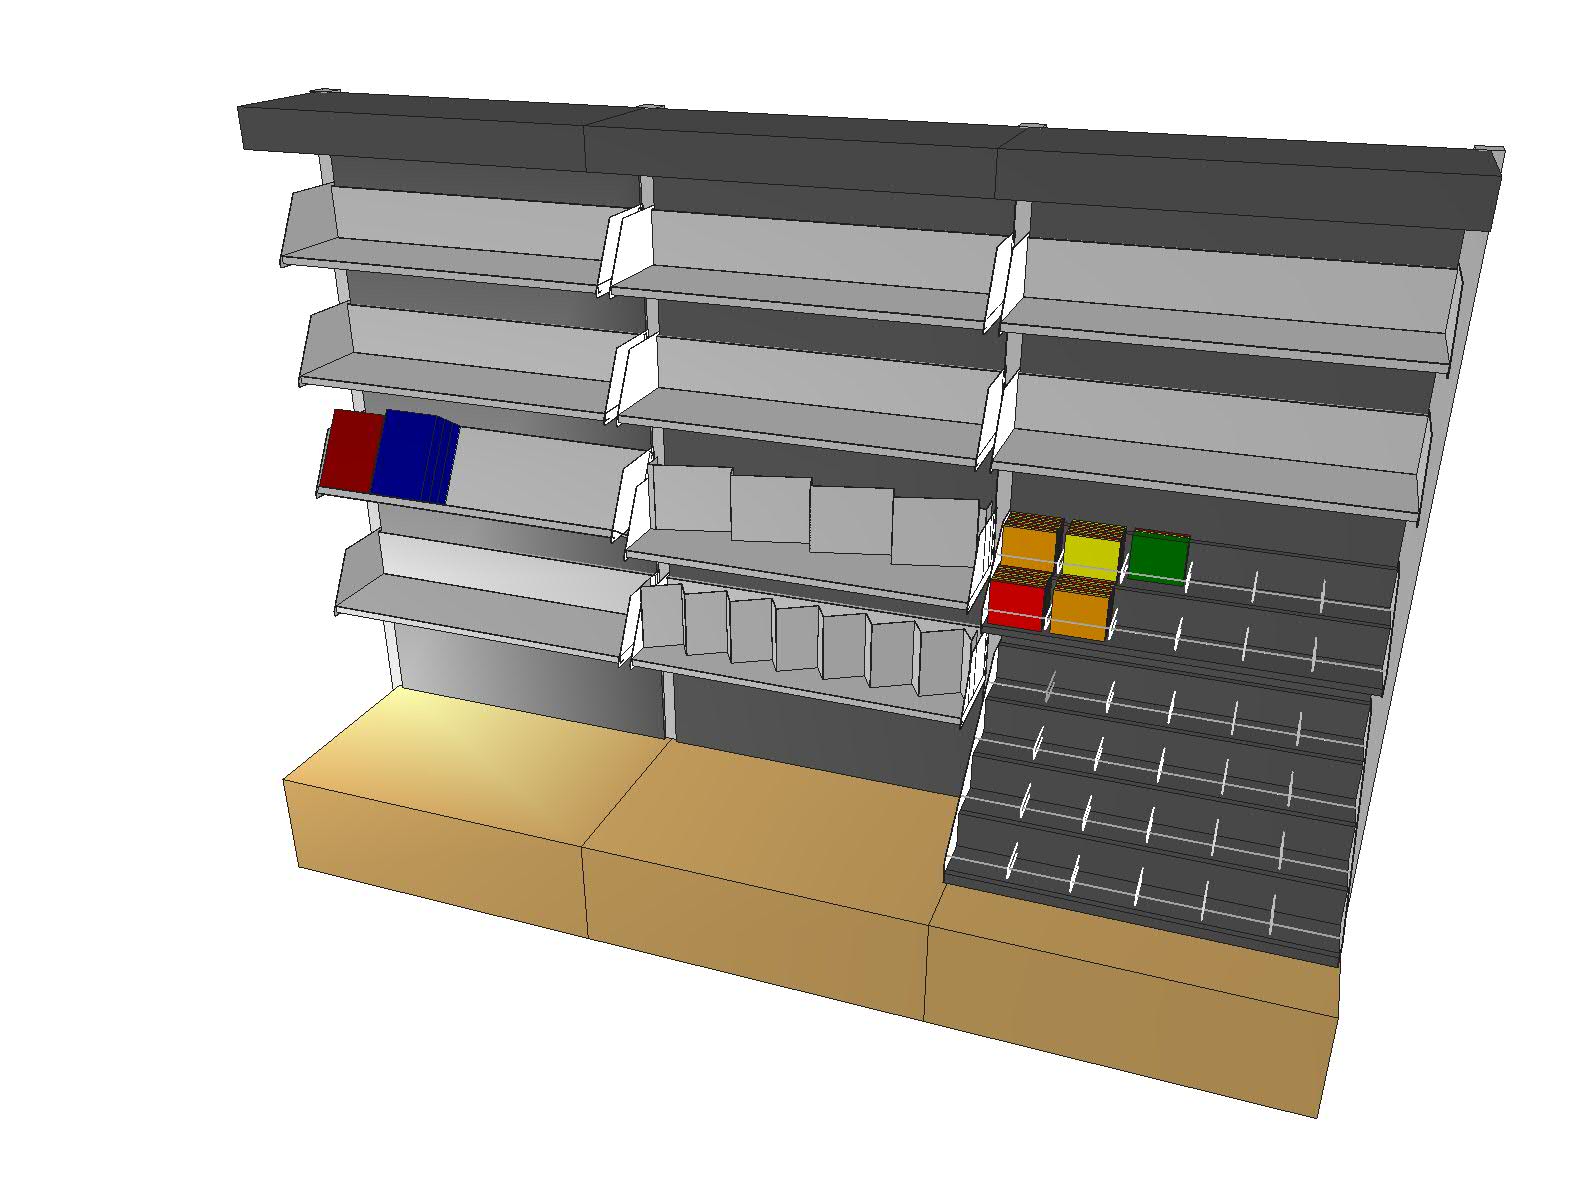
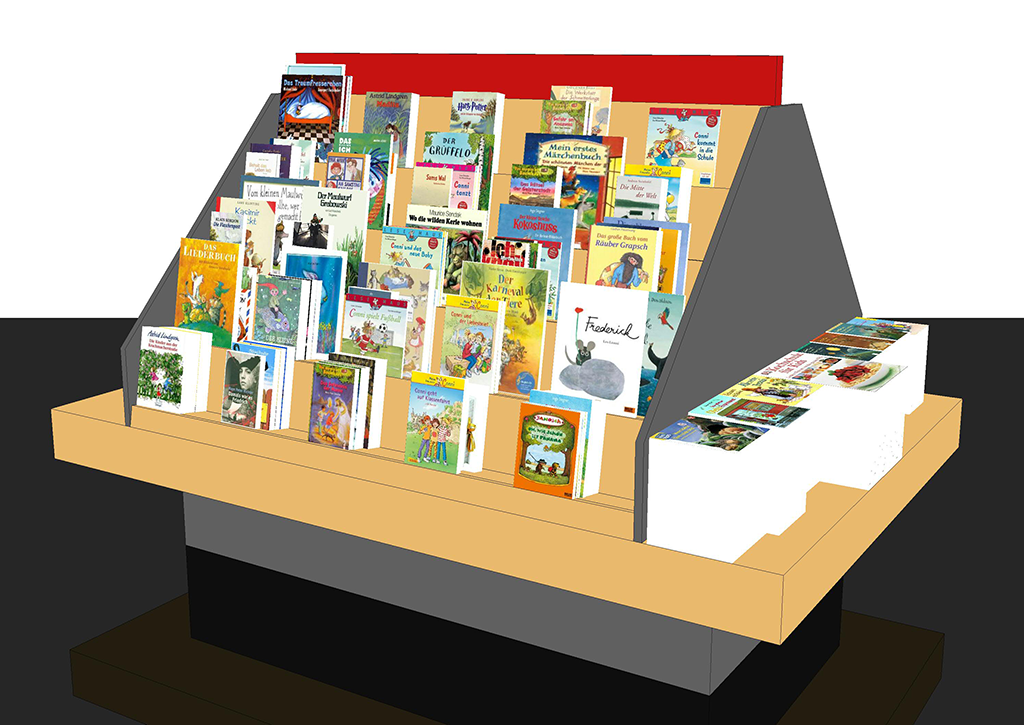
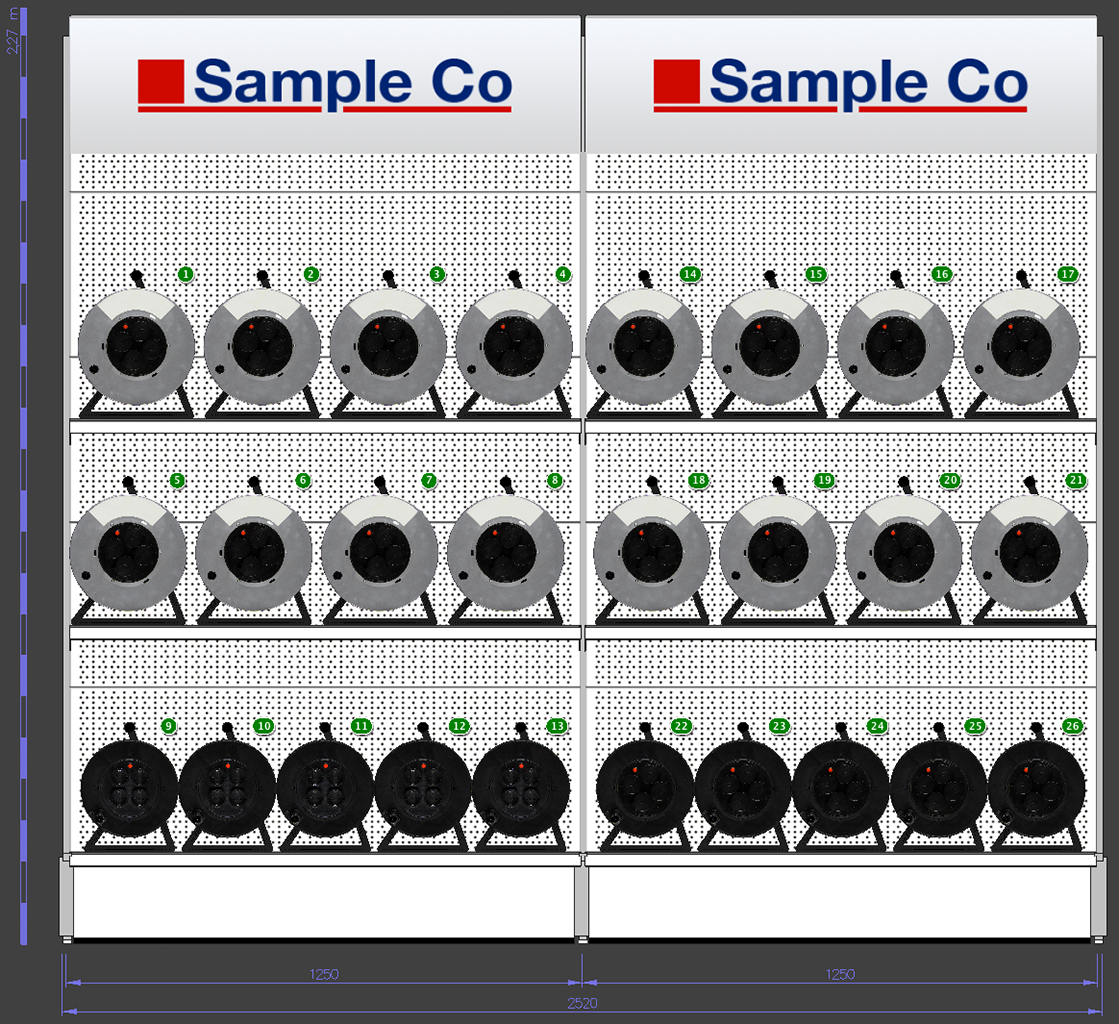
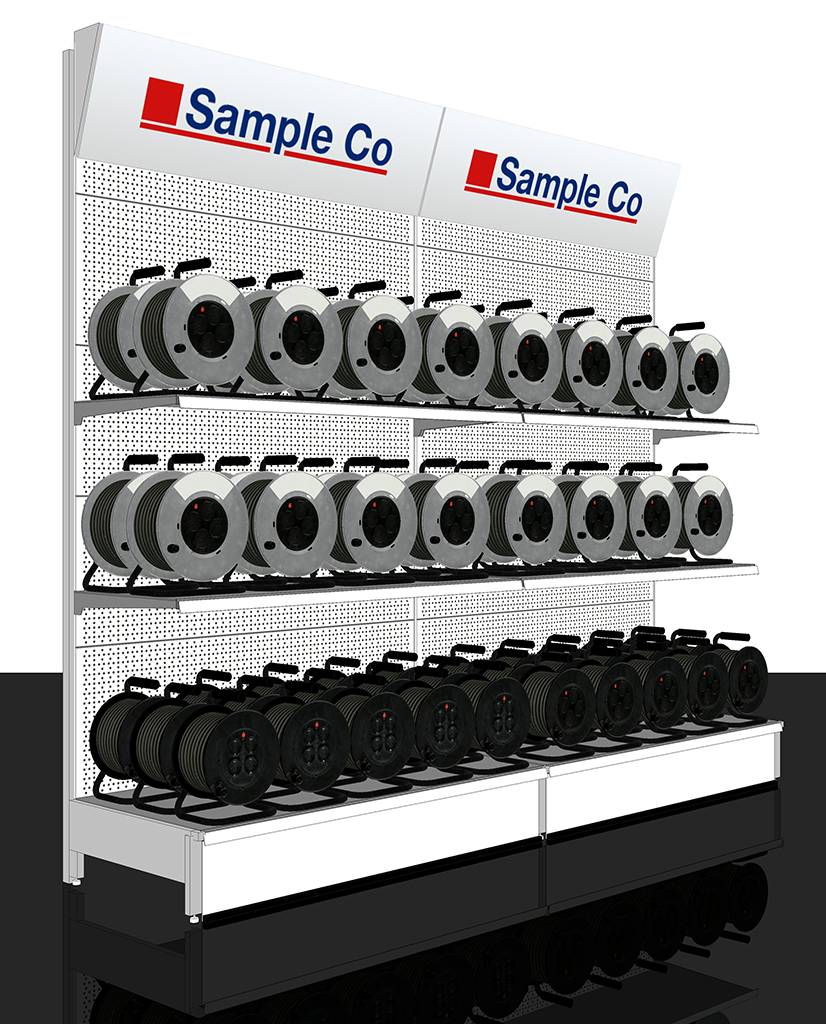
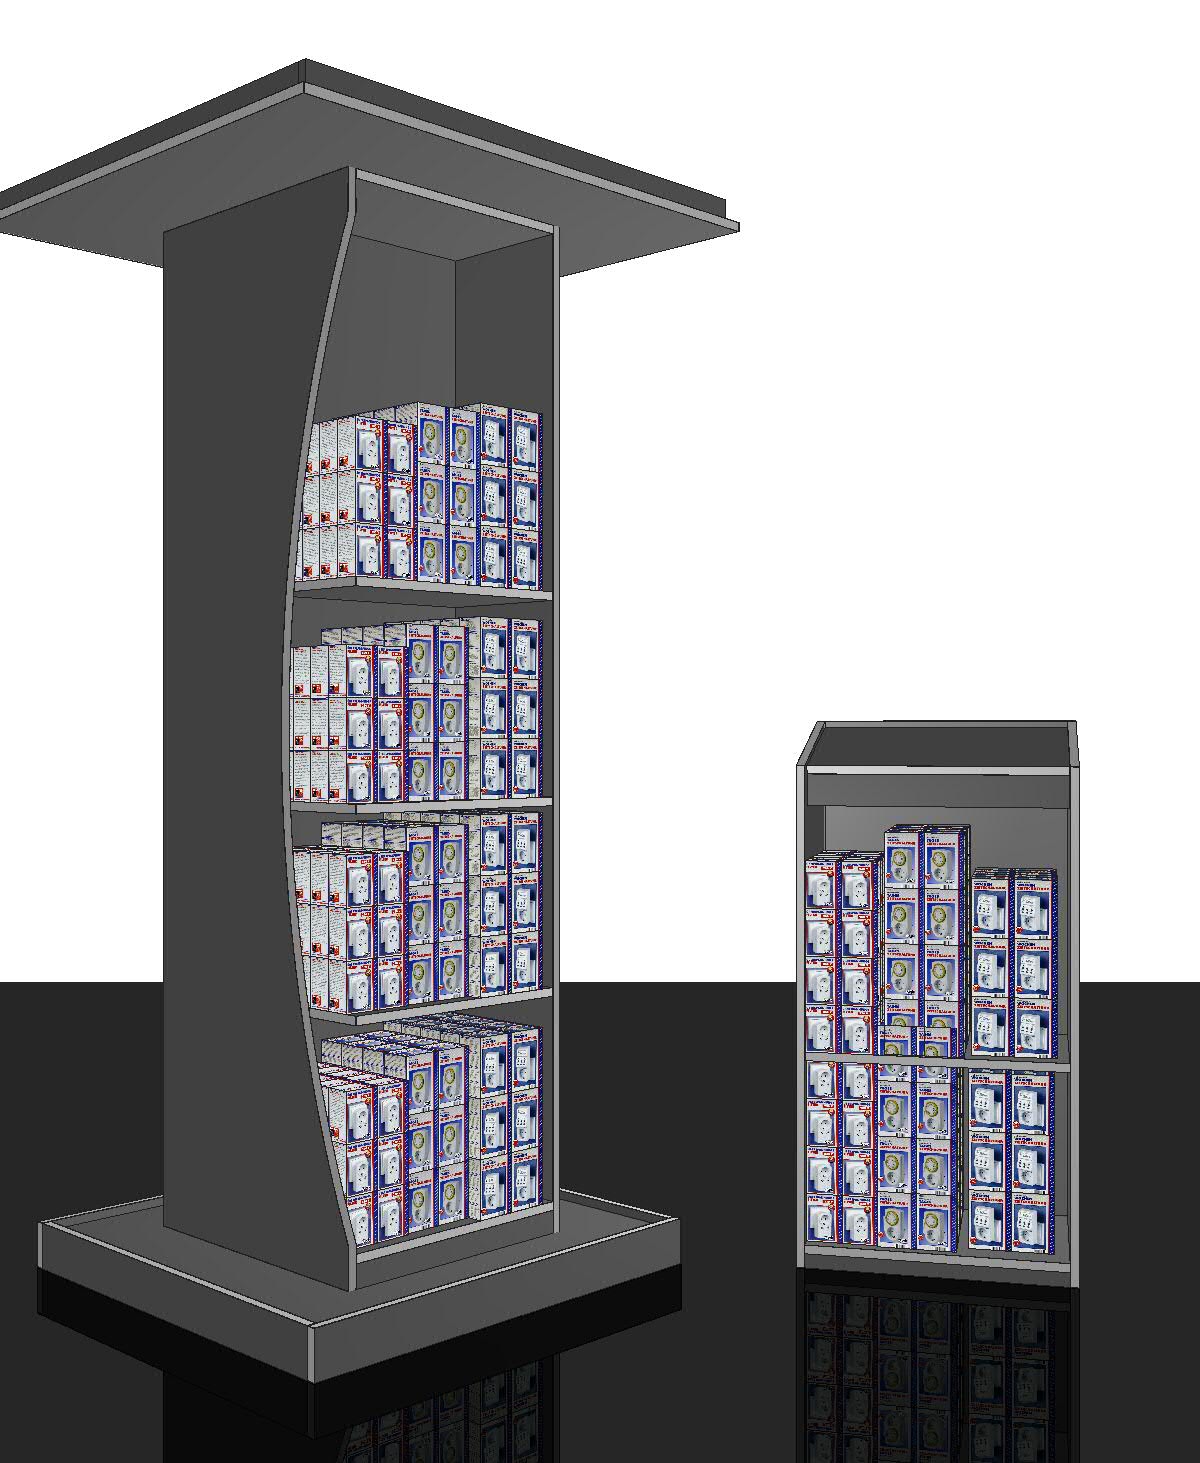
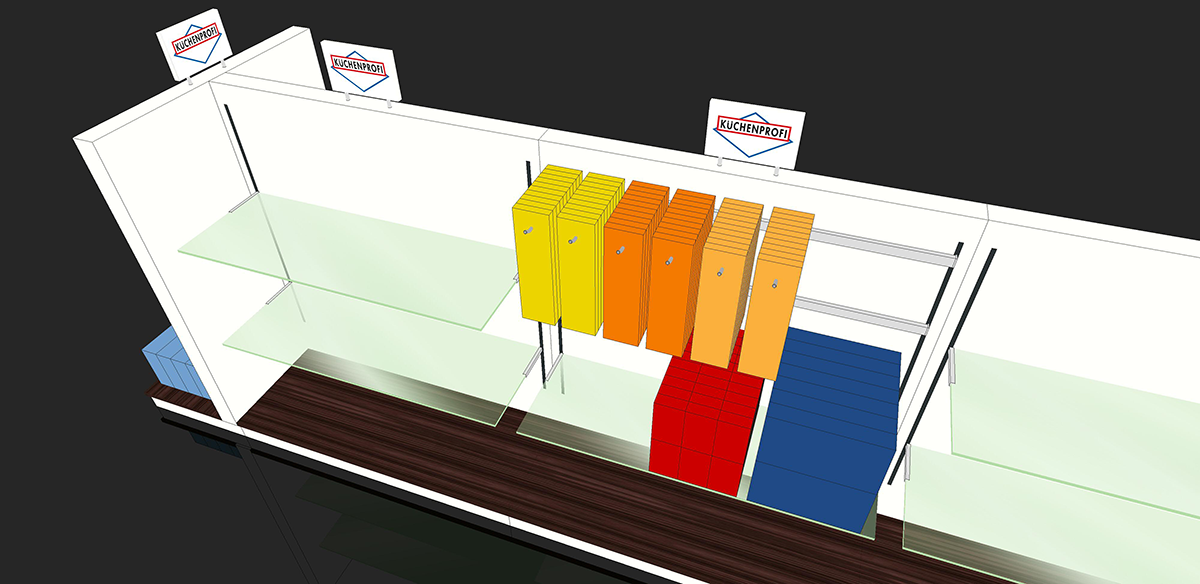
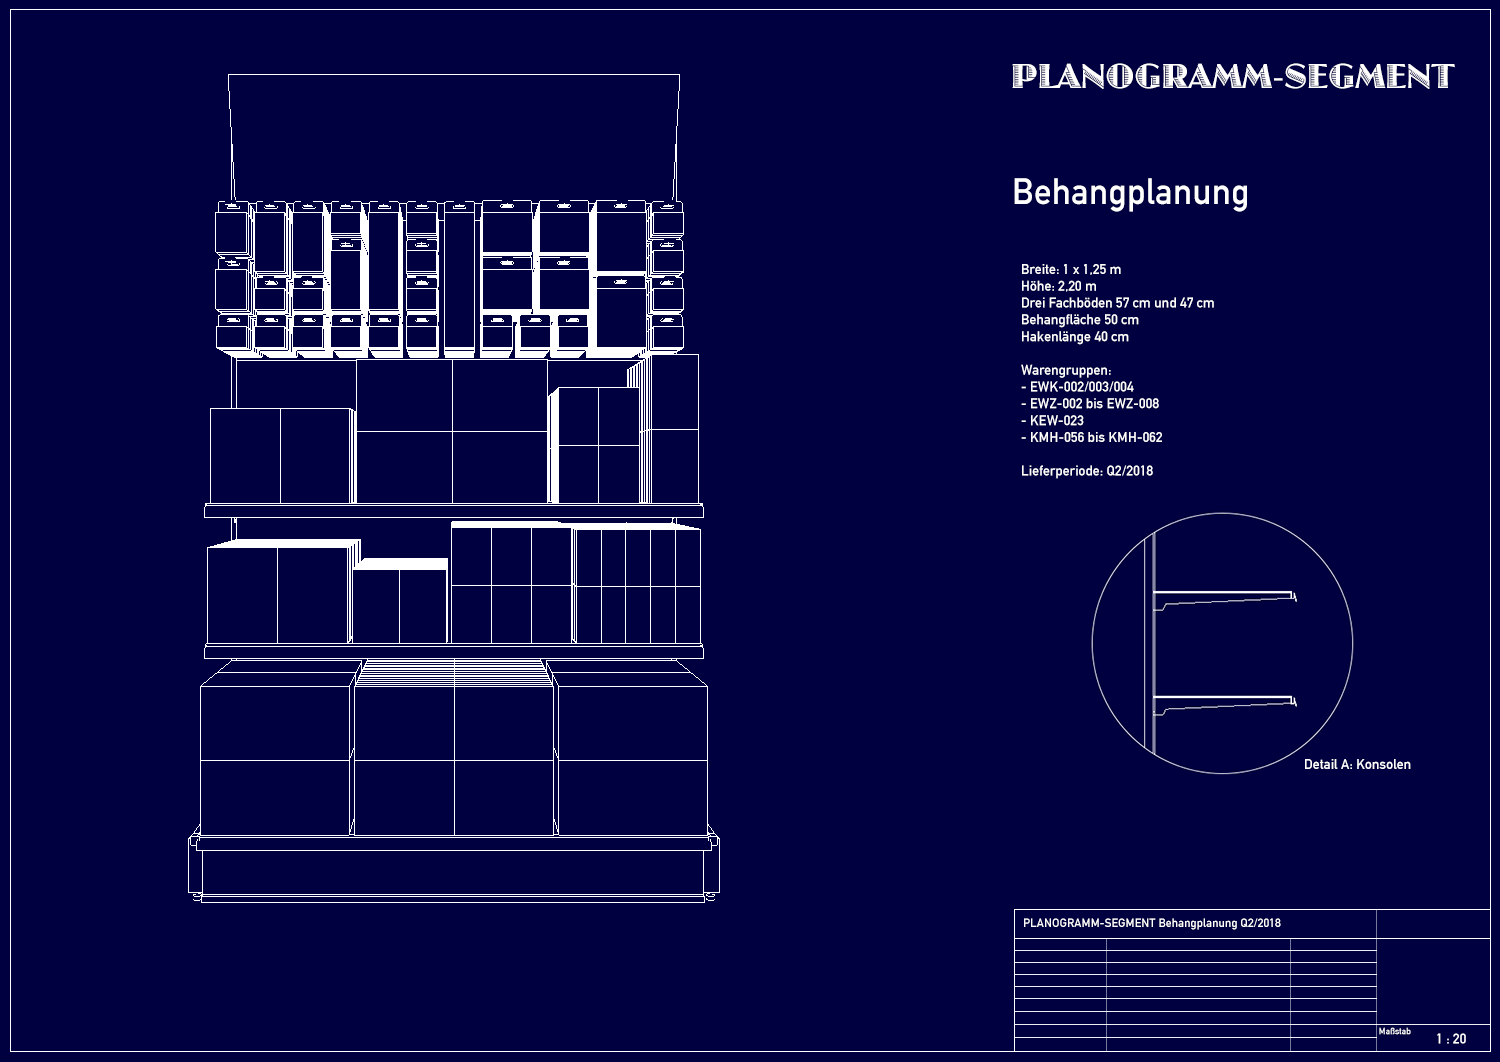
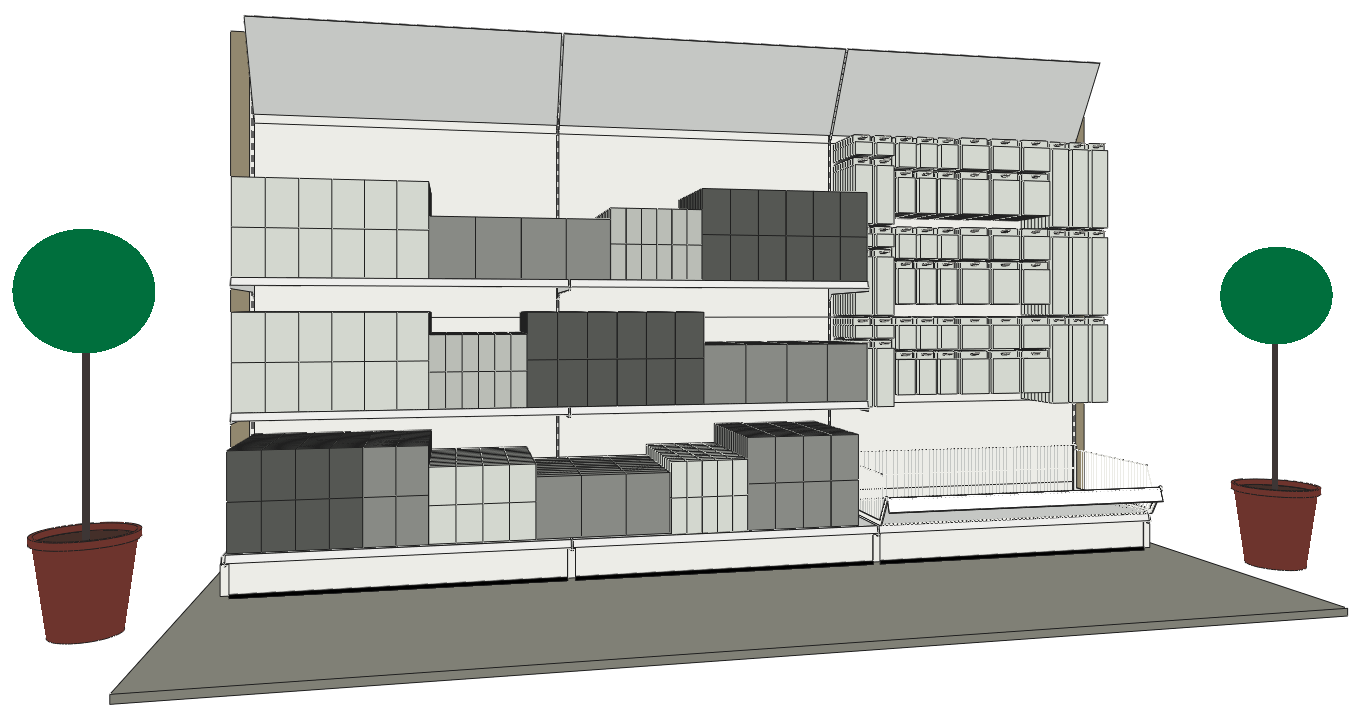
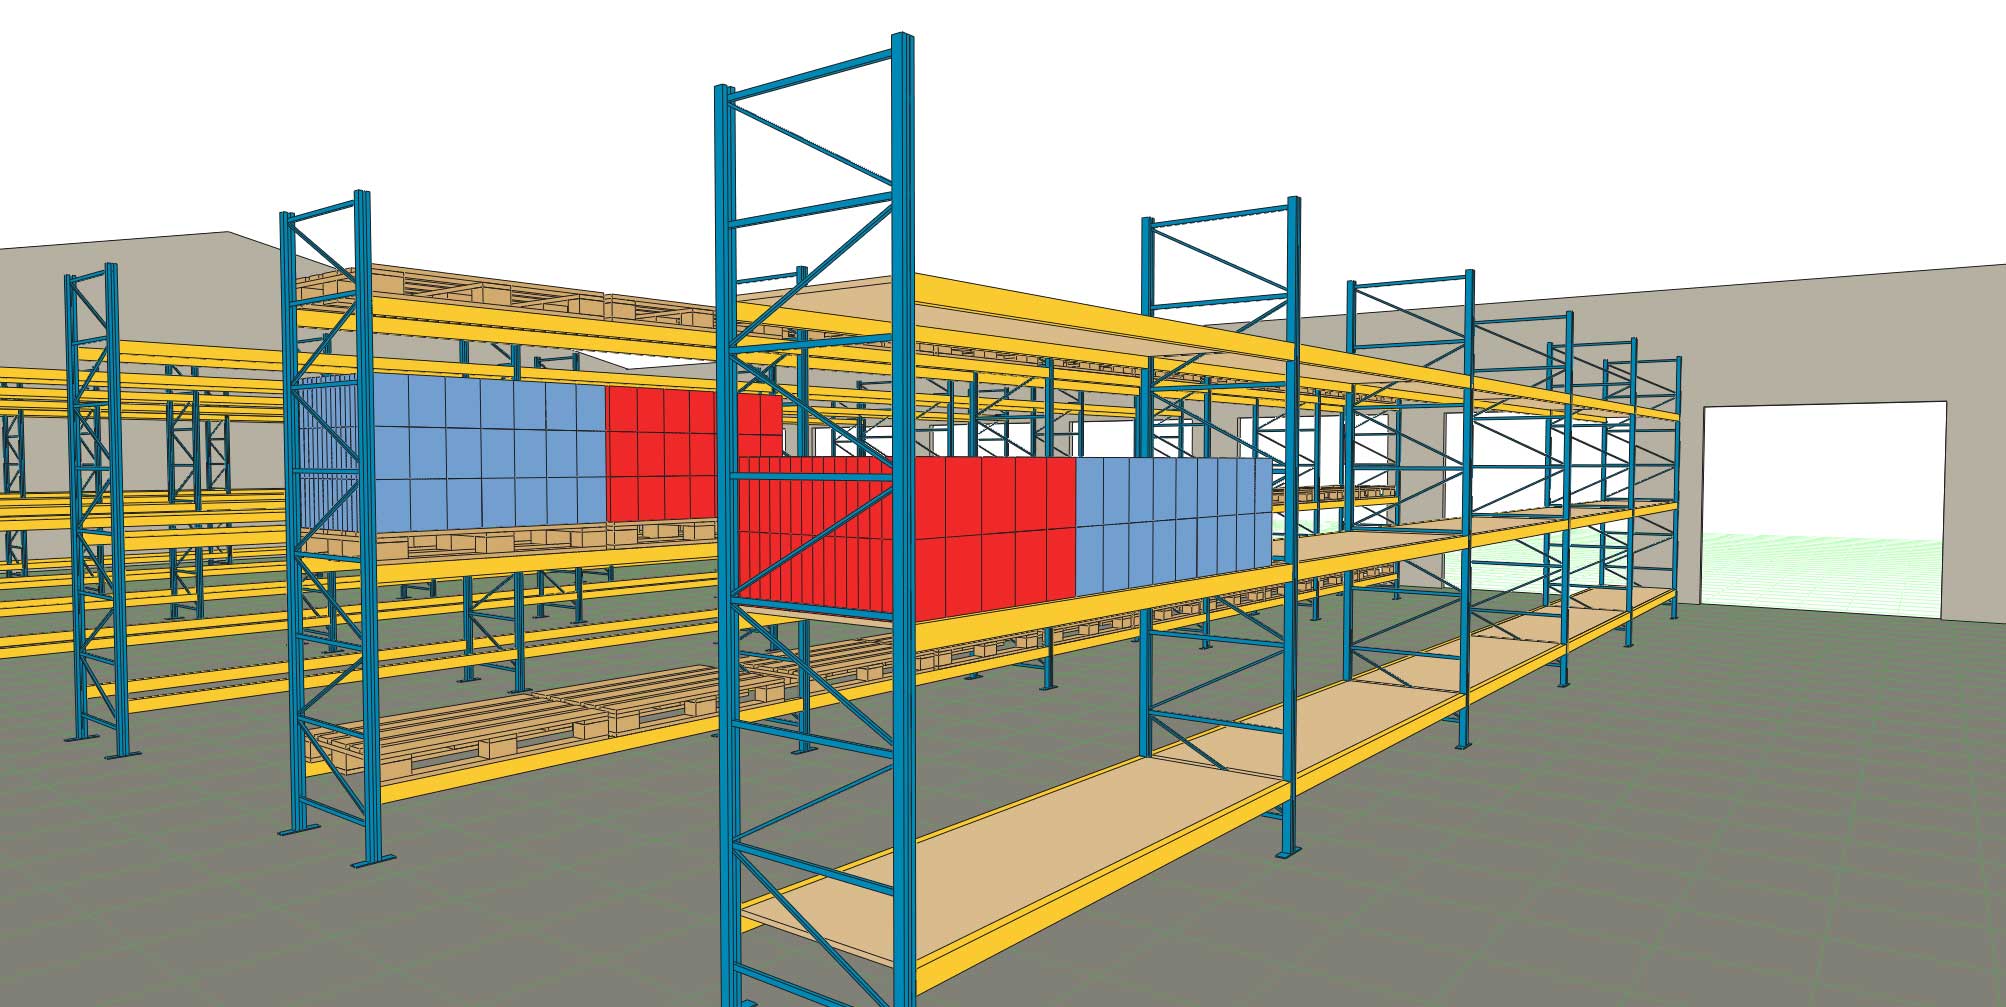
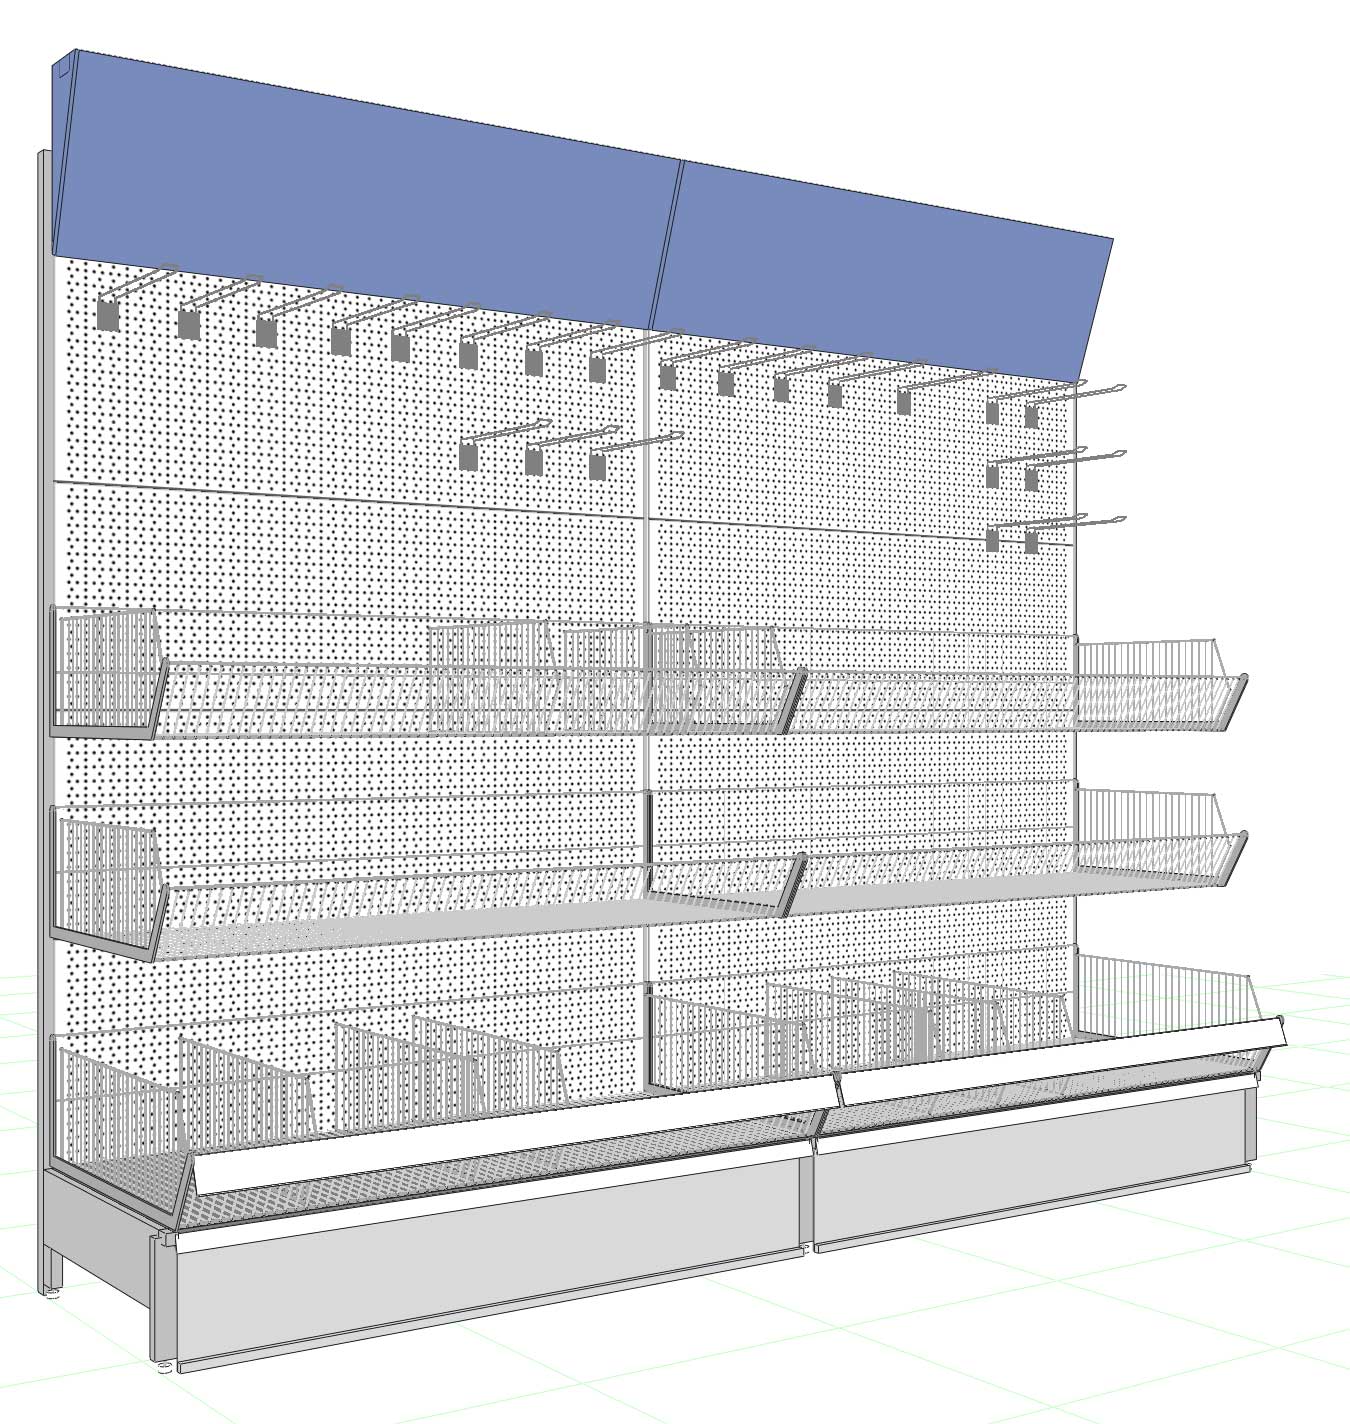
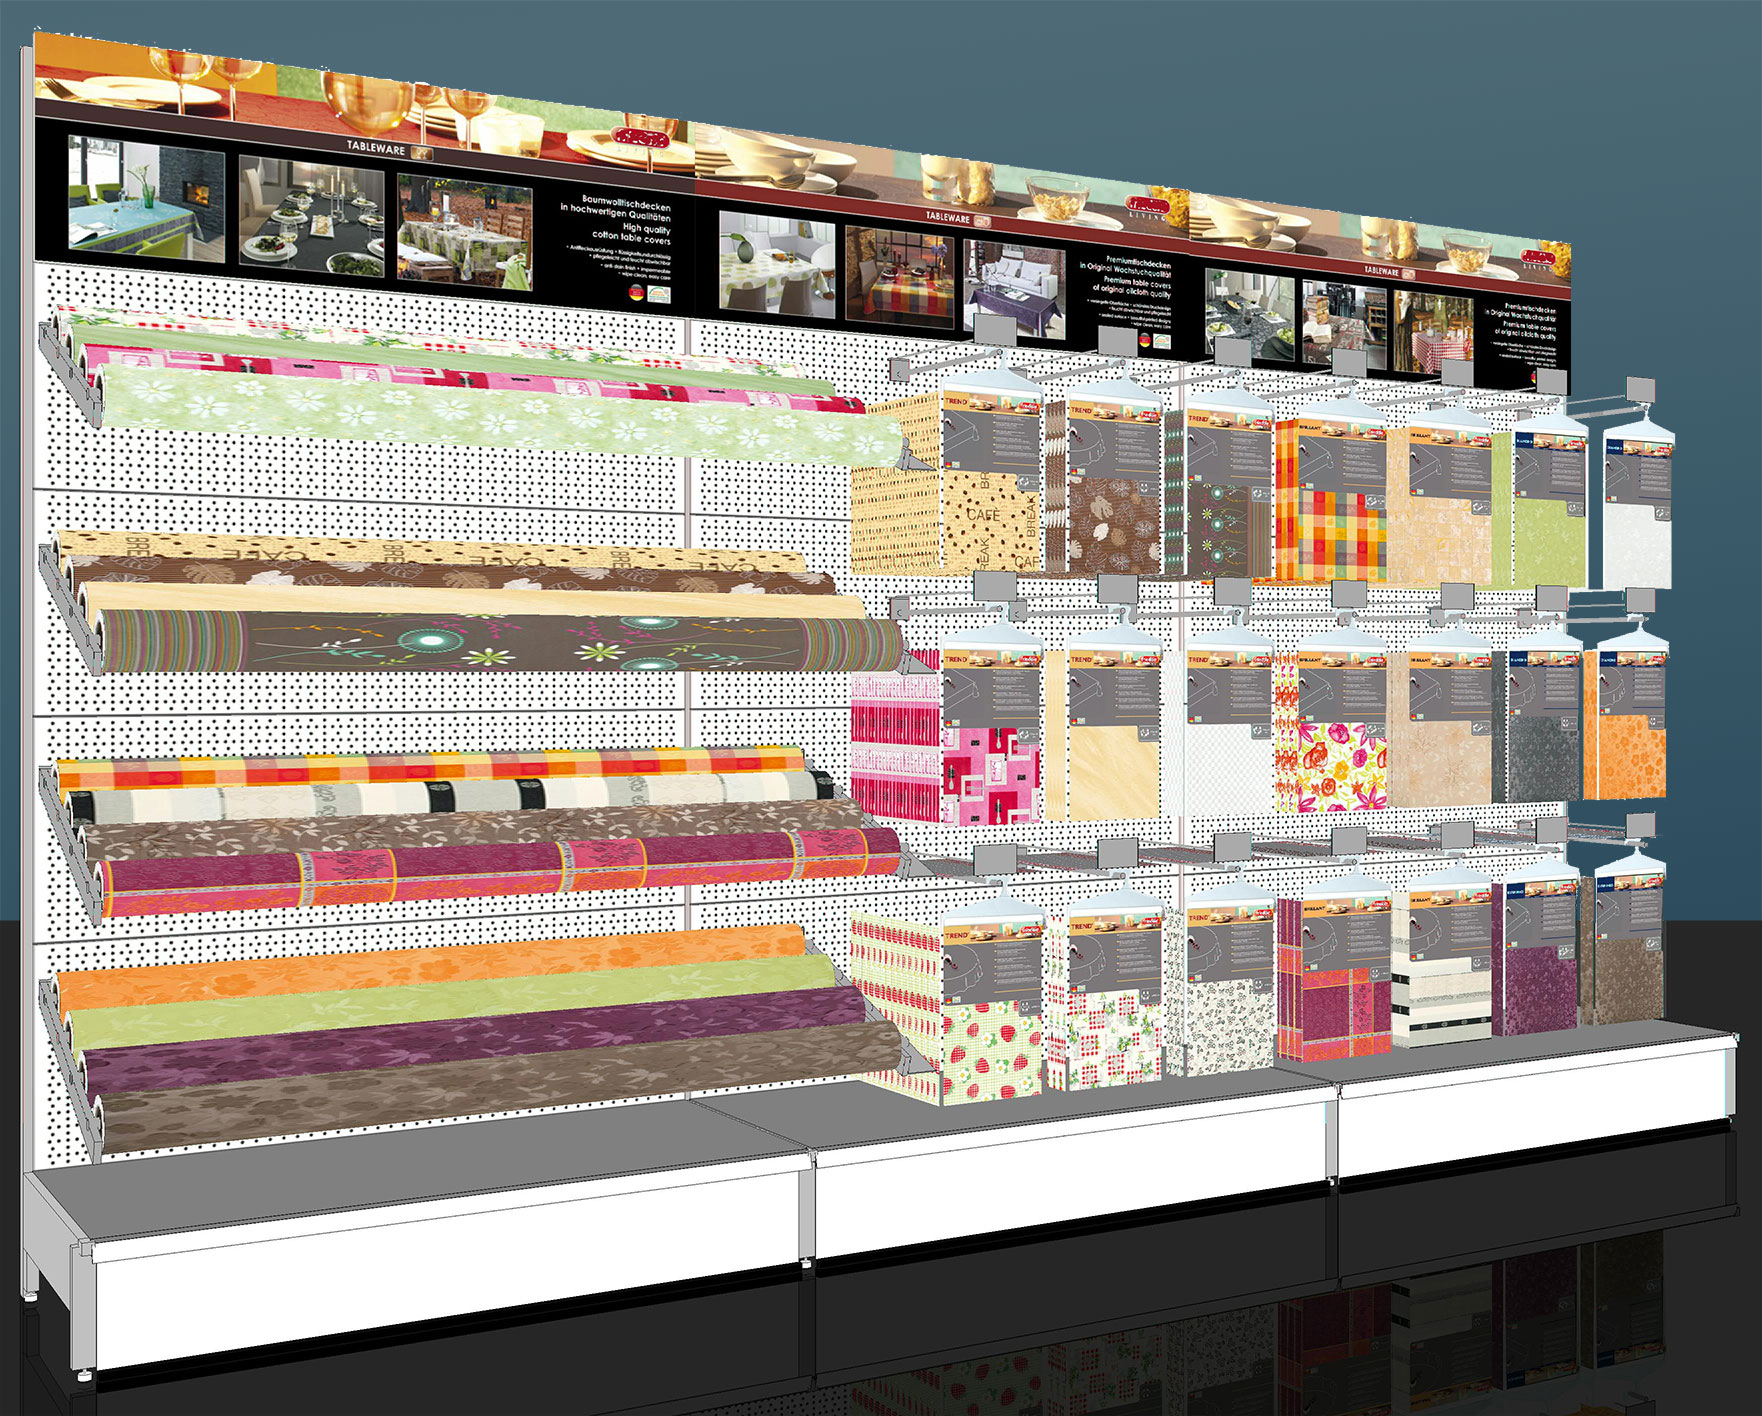
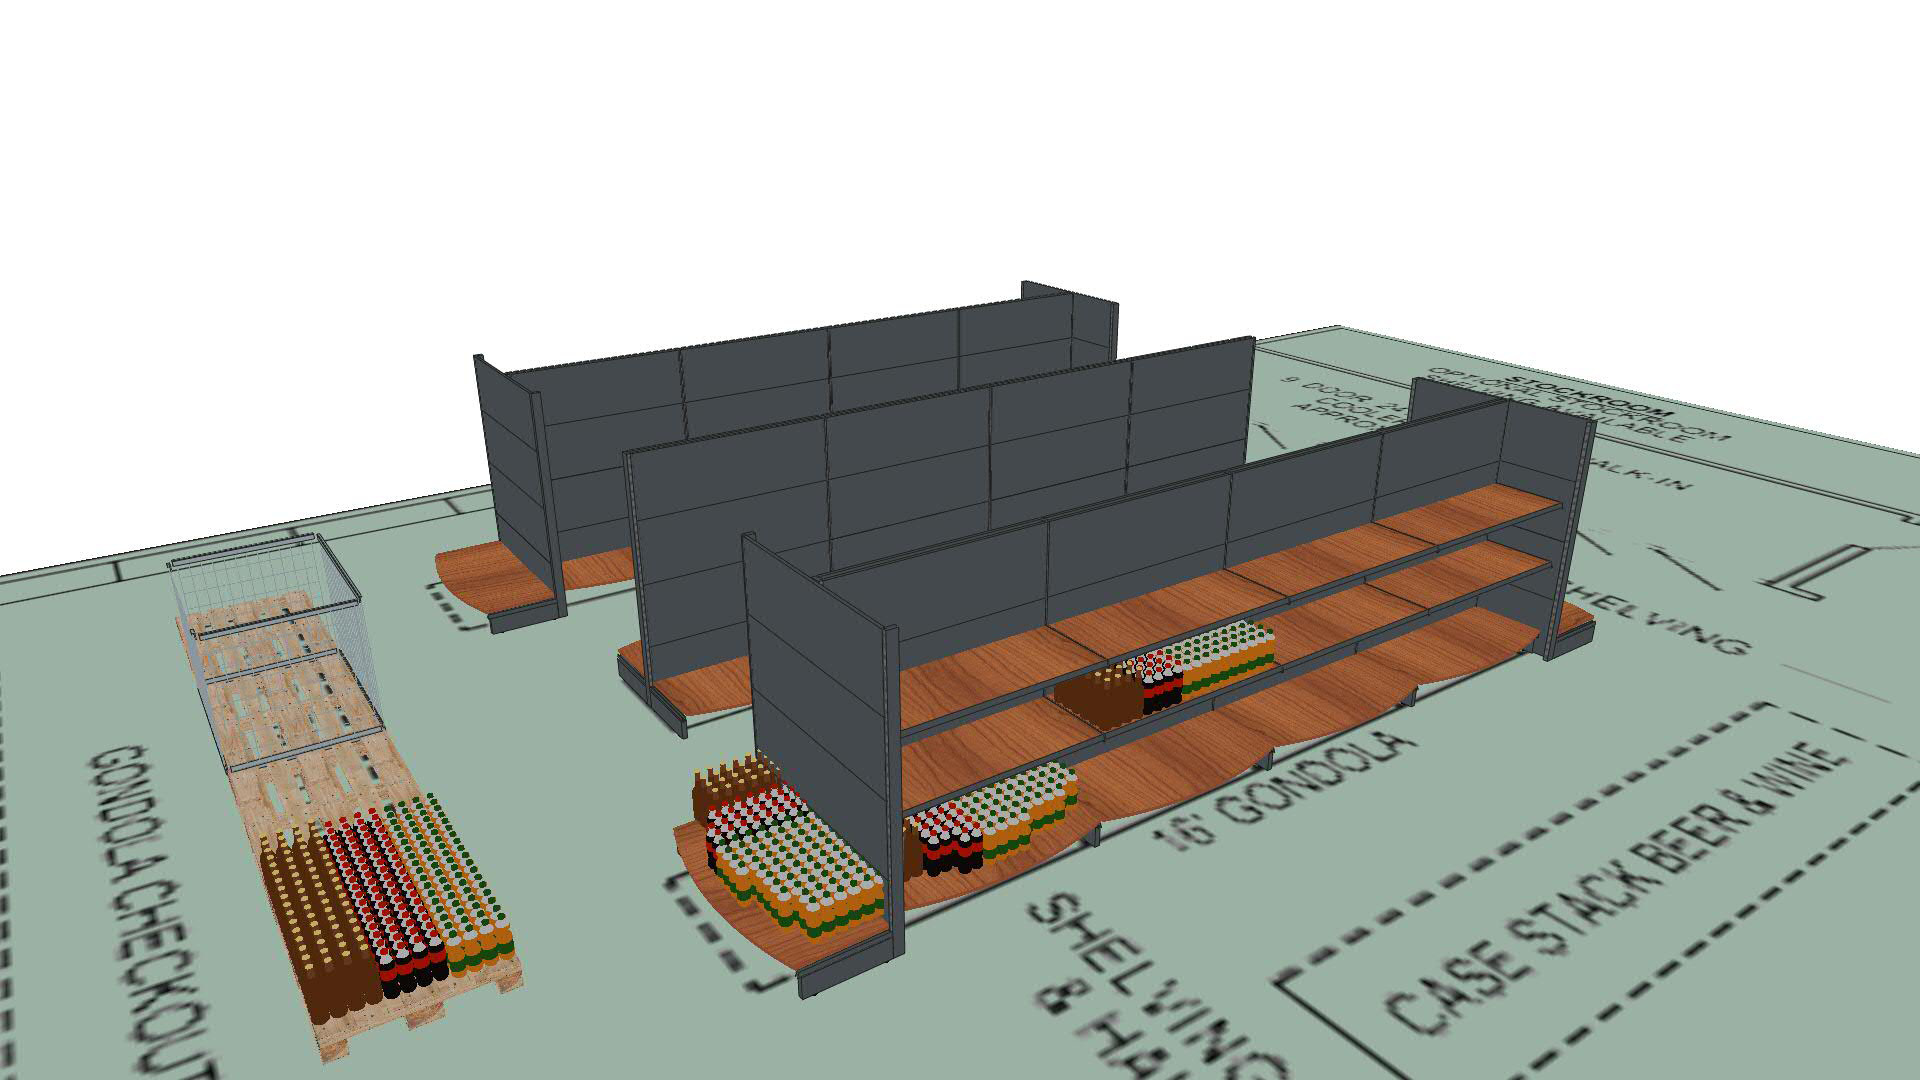
XPace creates high-quality planogram graphics, in 2D or 3D, as box graphics or with product images, with labeling and dimensioning if desired. Reports are list-oriented outputs with or without planogram graphics, in PDF or Excel format. The gallery shows some typical examples of planograms and reports.
Videos
[service title=”XPace Videos” icon=”icon: vimeo-square” icon_color=”#61a05b”]We publish videos (demos, podcasts, tutorials) about XPace on Vimeo: XPace Video Portfolio. Or watch our embedded videos.
[/service]On this page:
Planograms • Screenshots • Reports
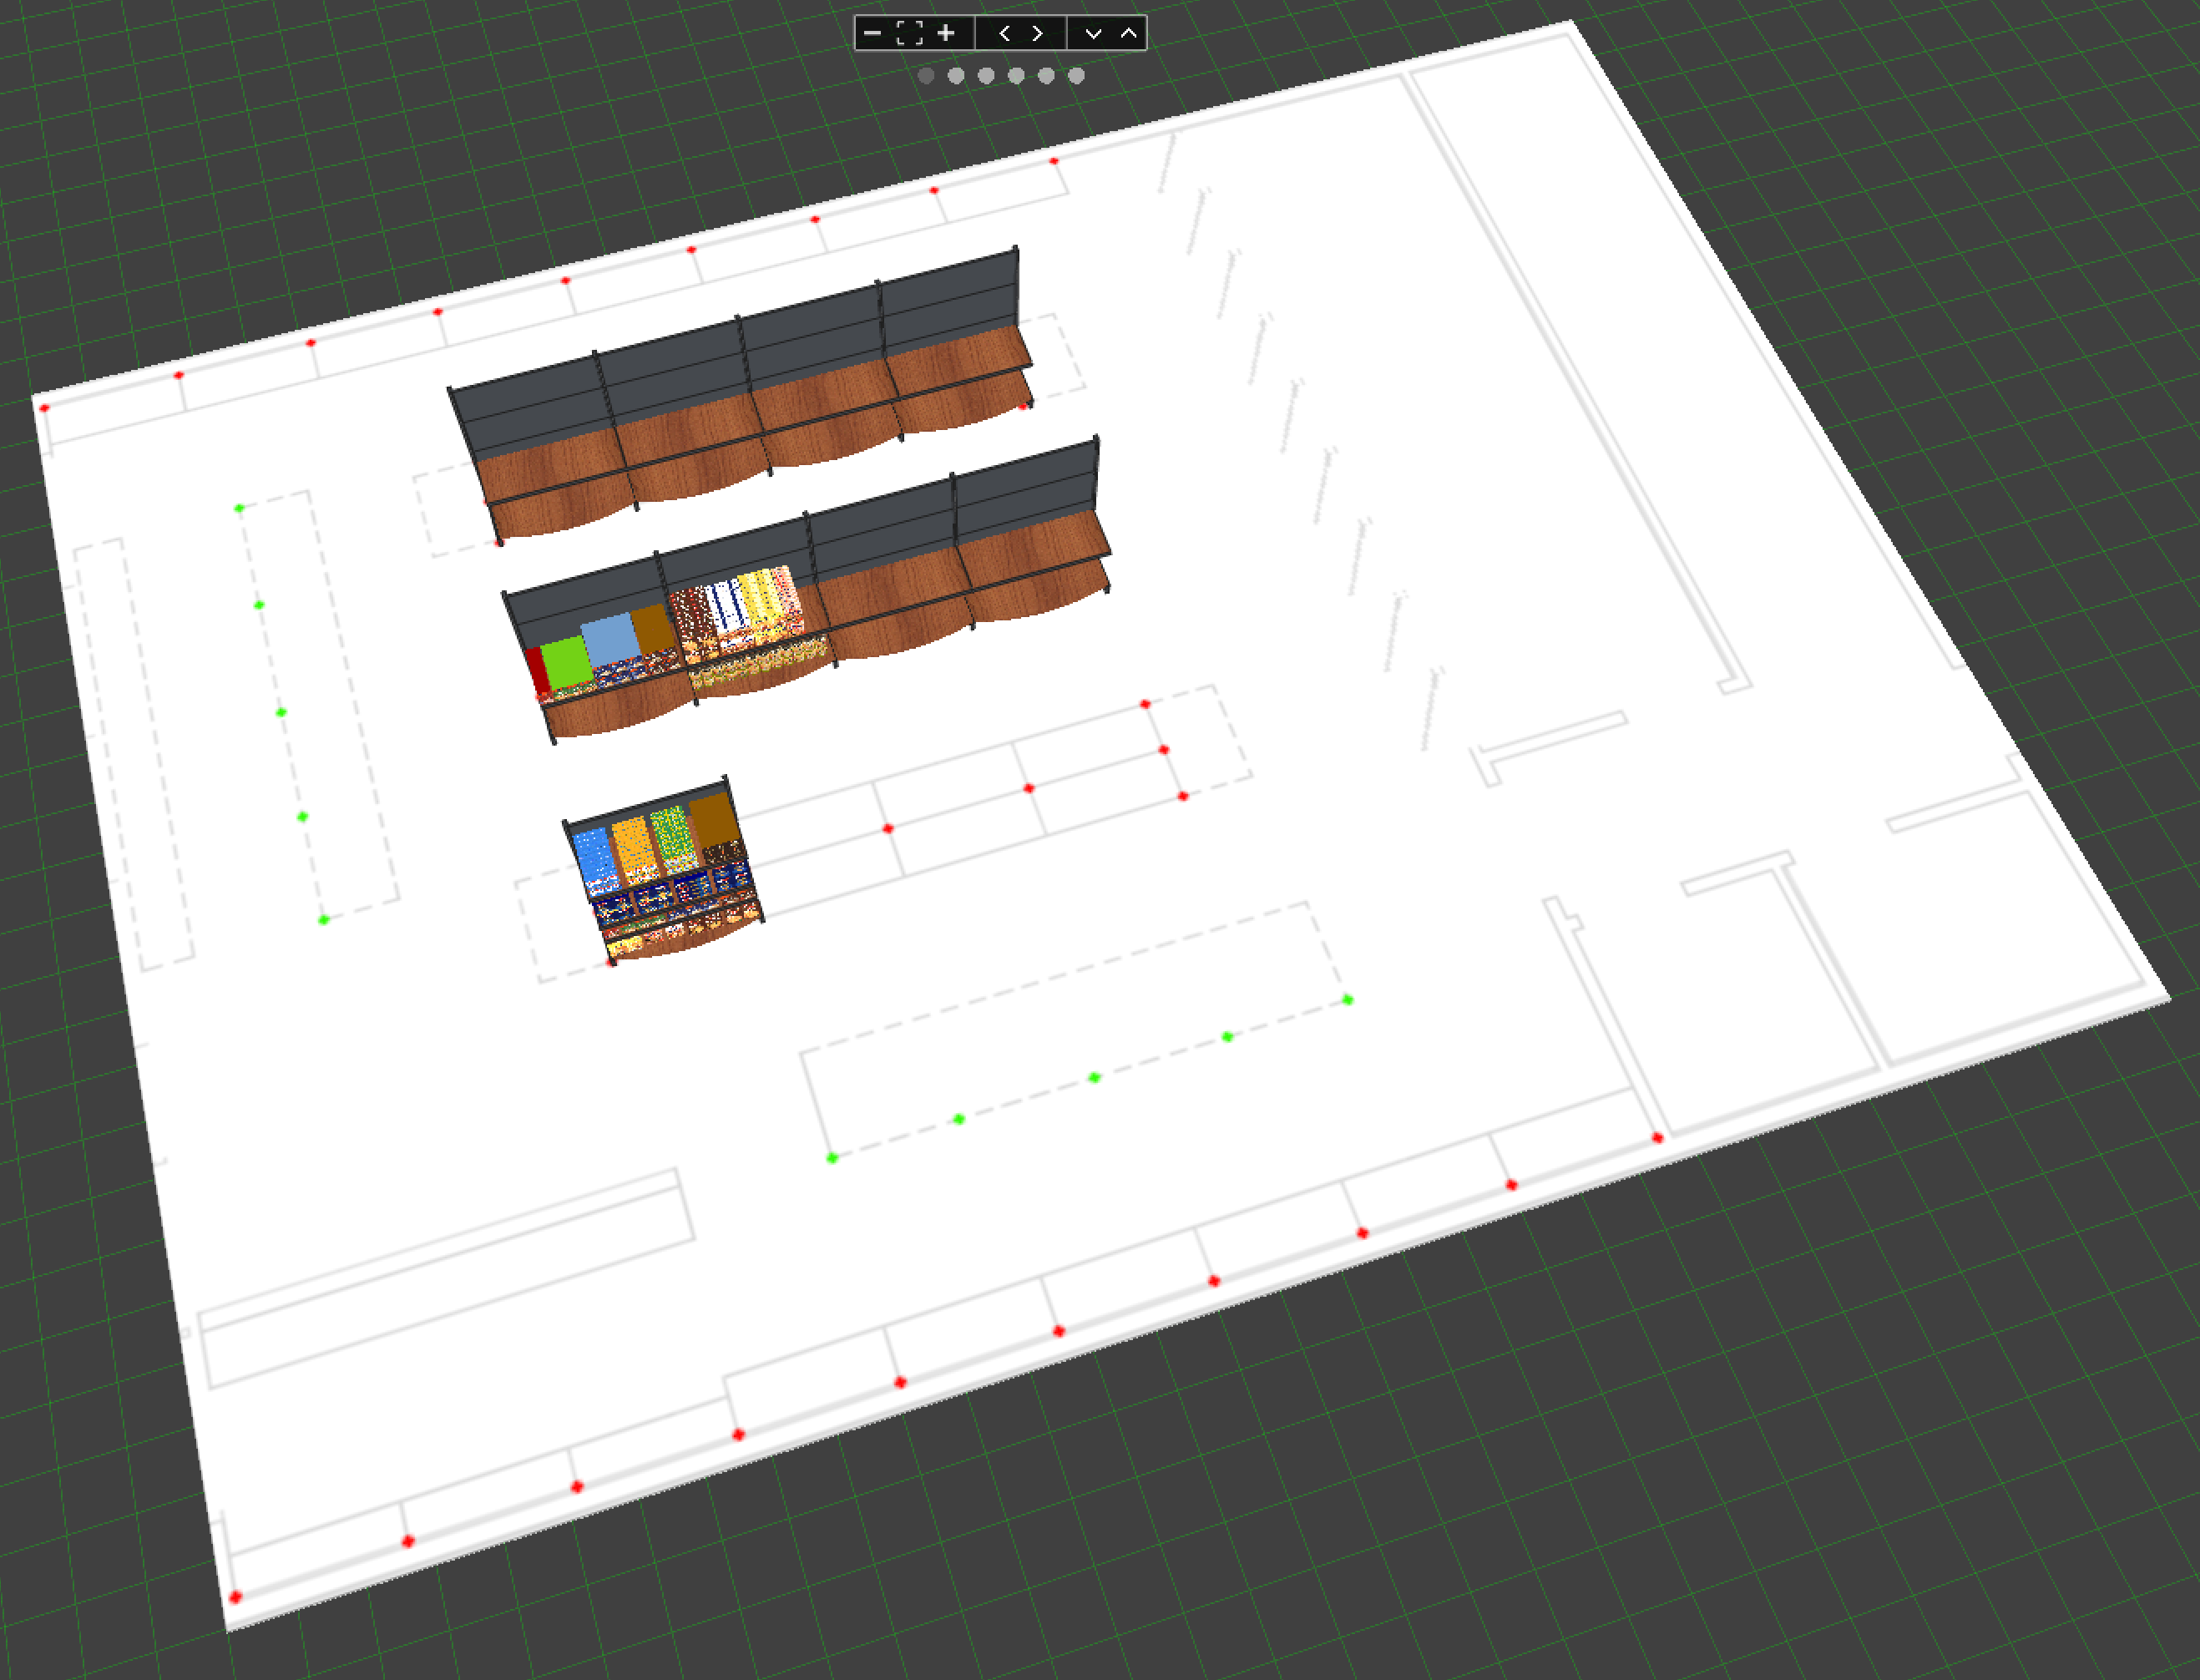
Sample Planograms


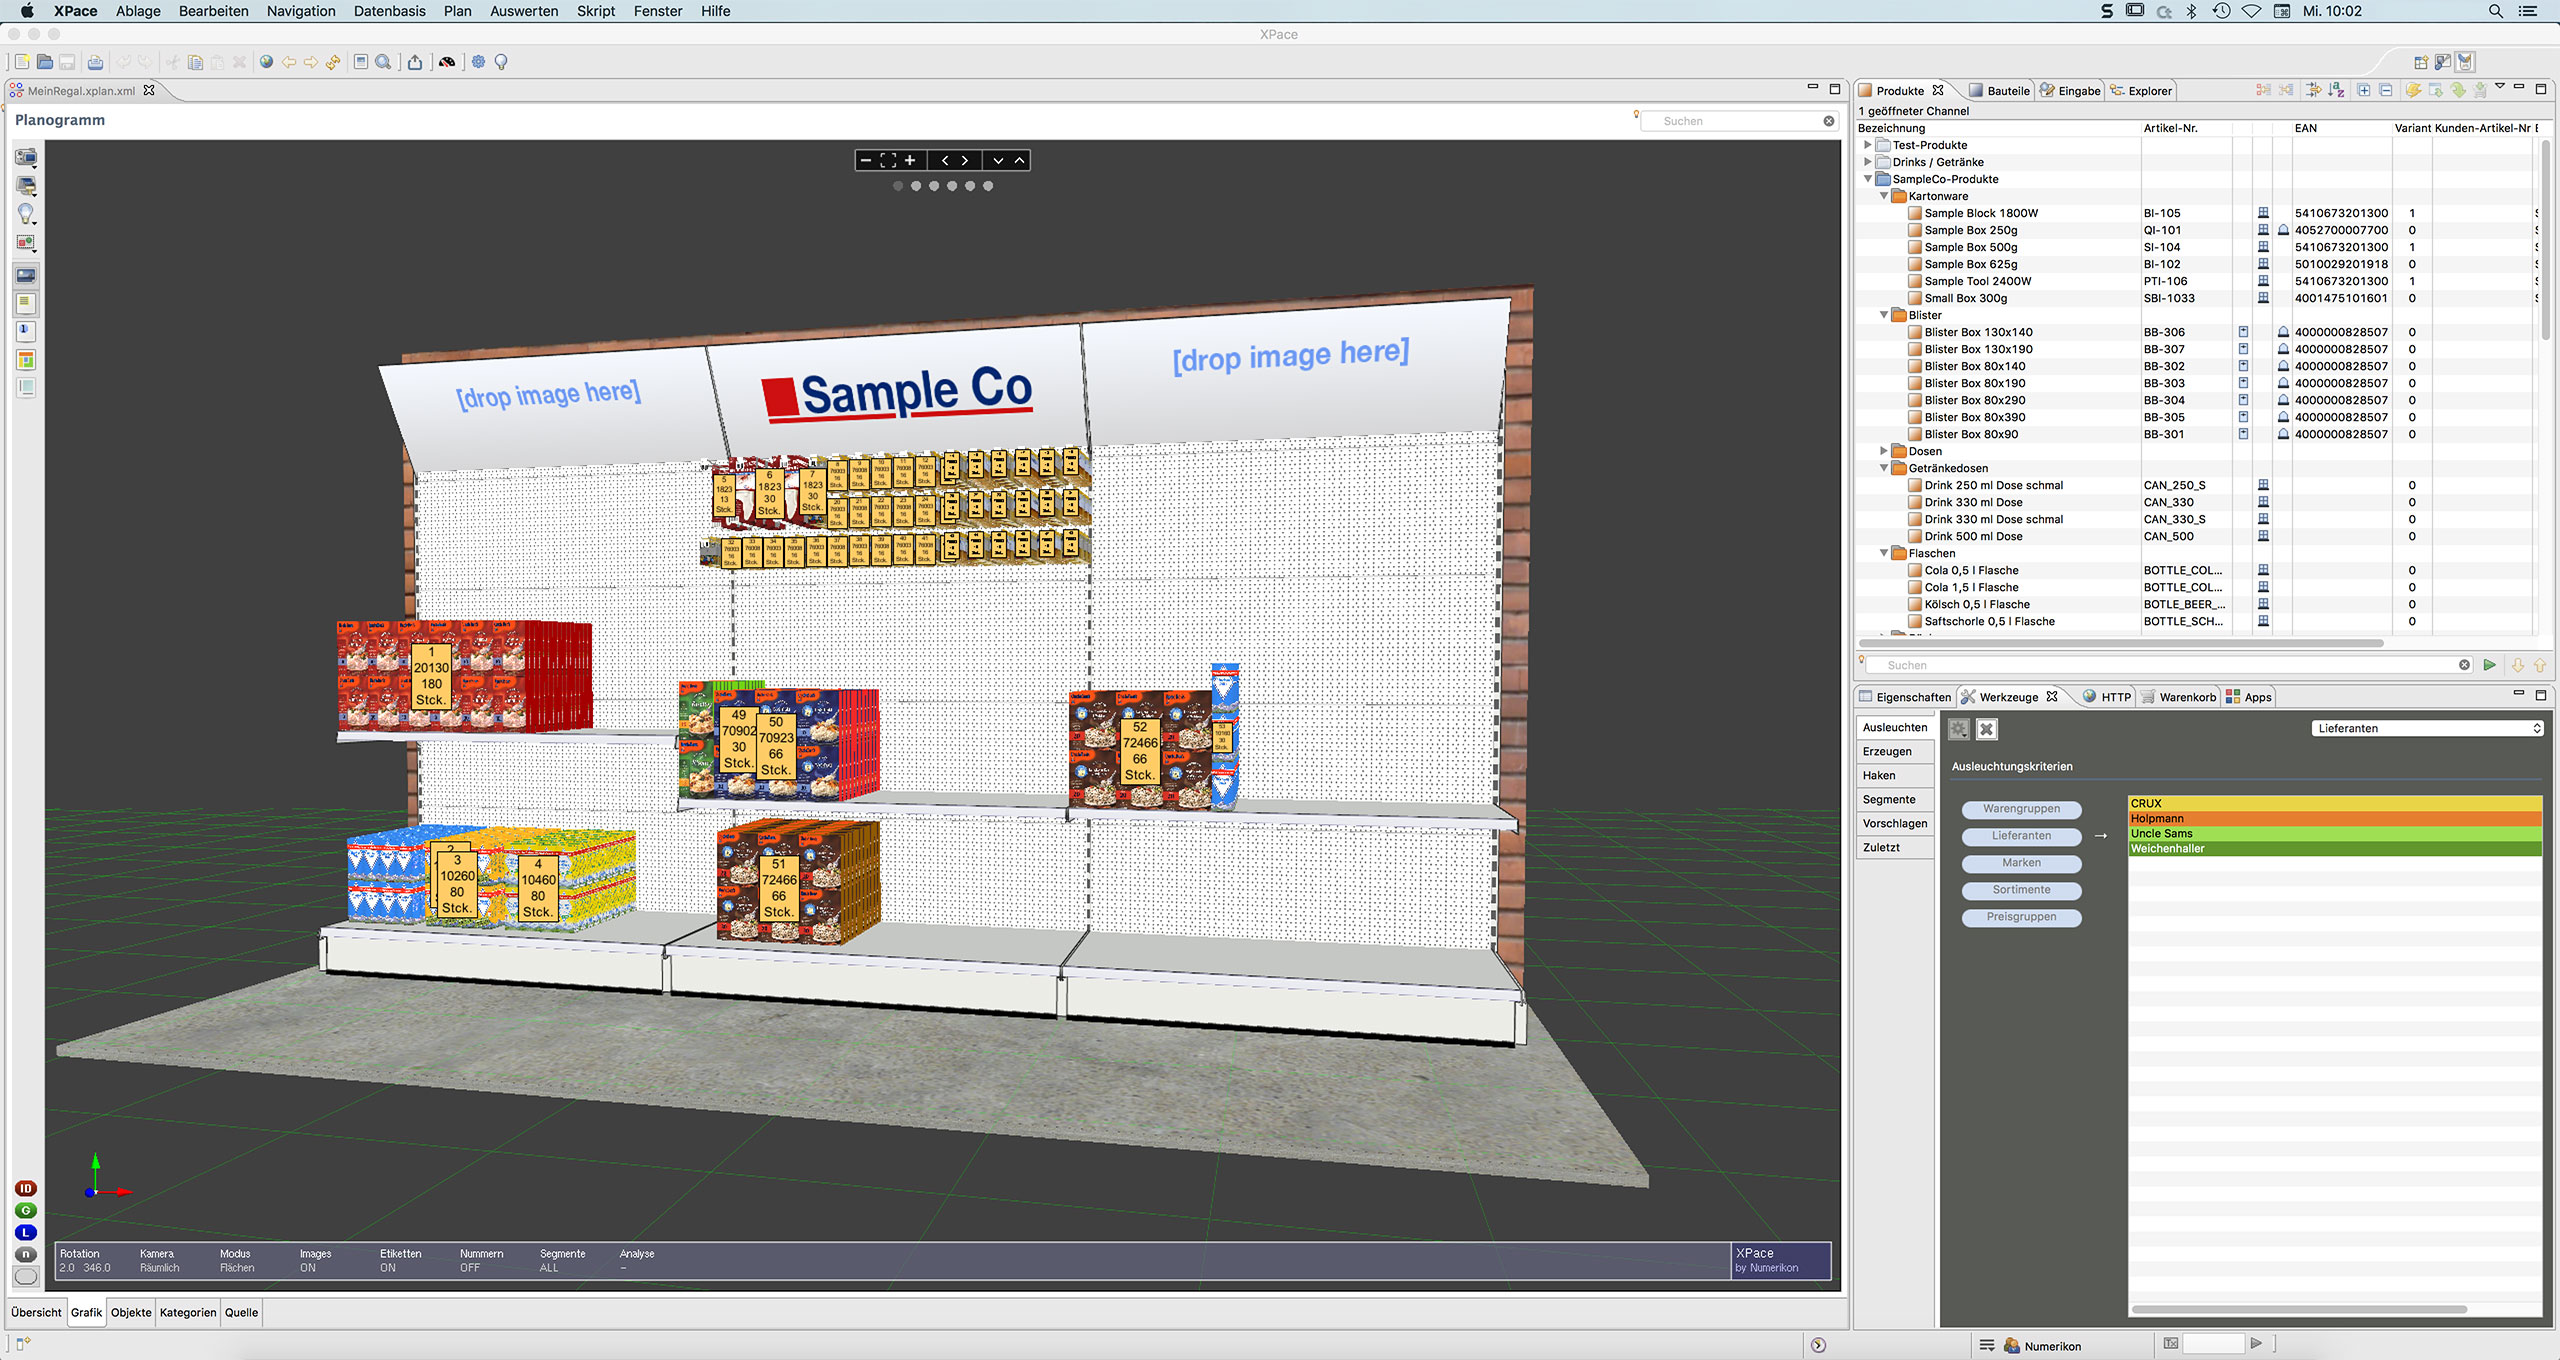
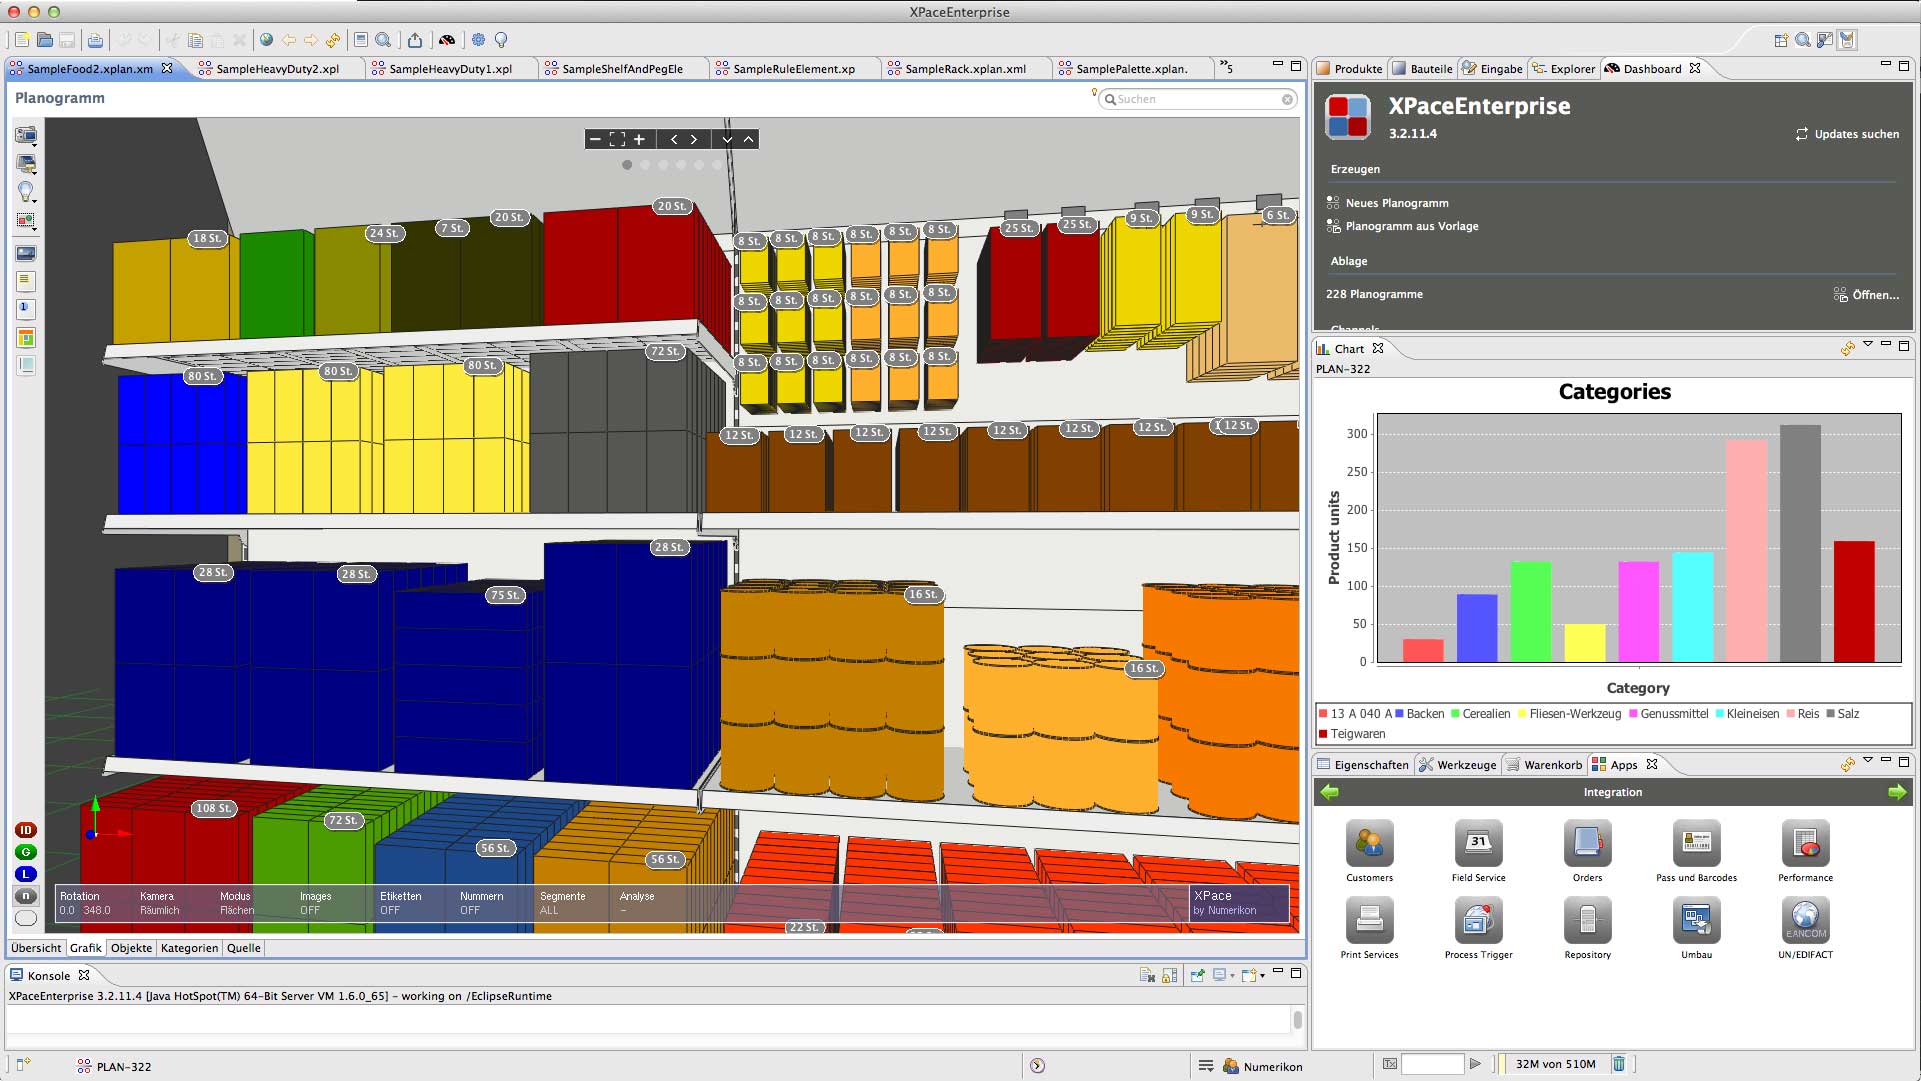
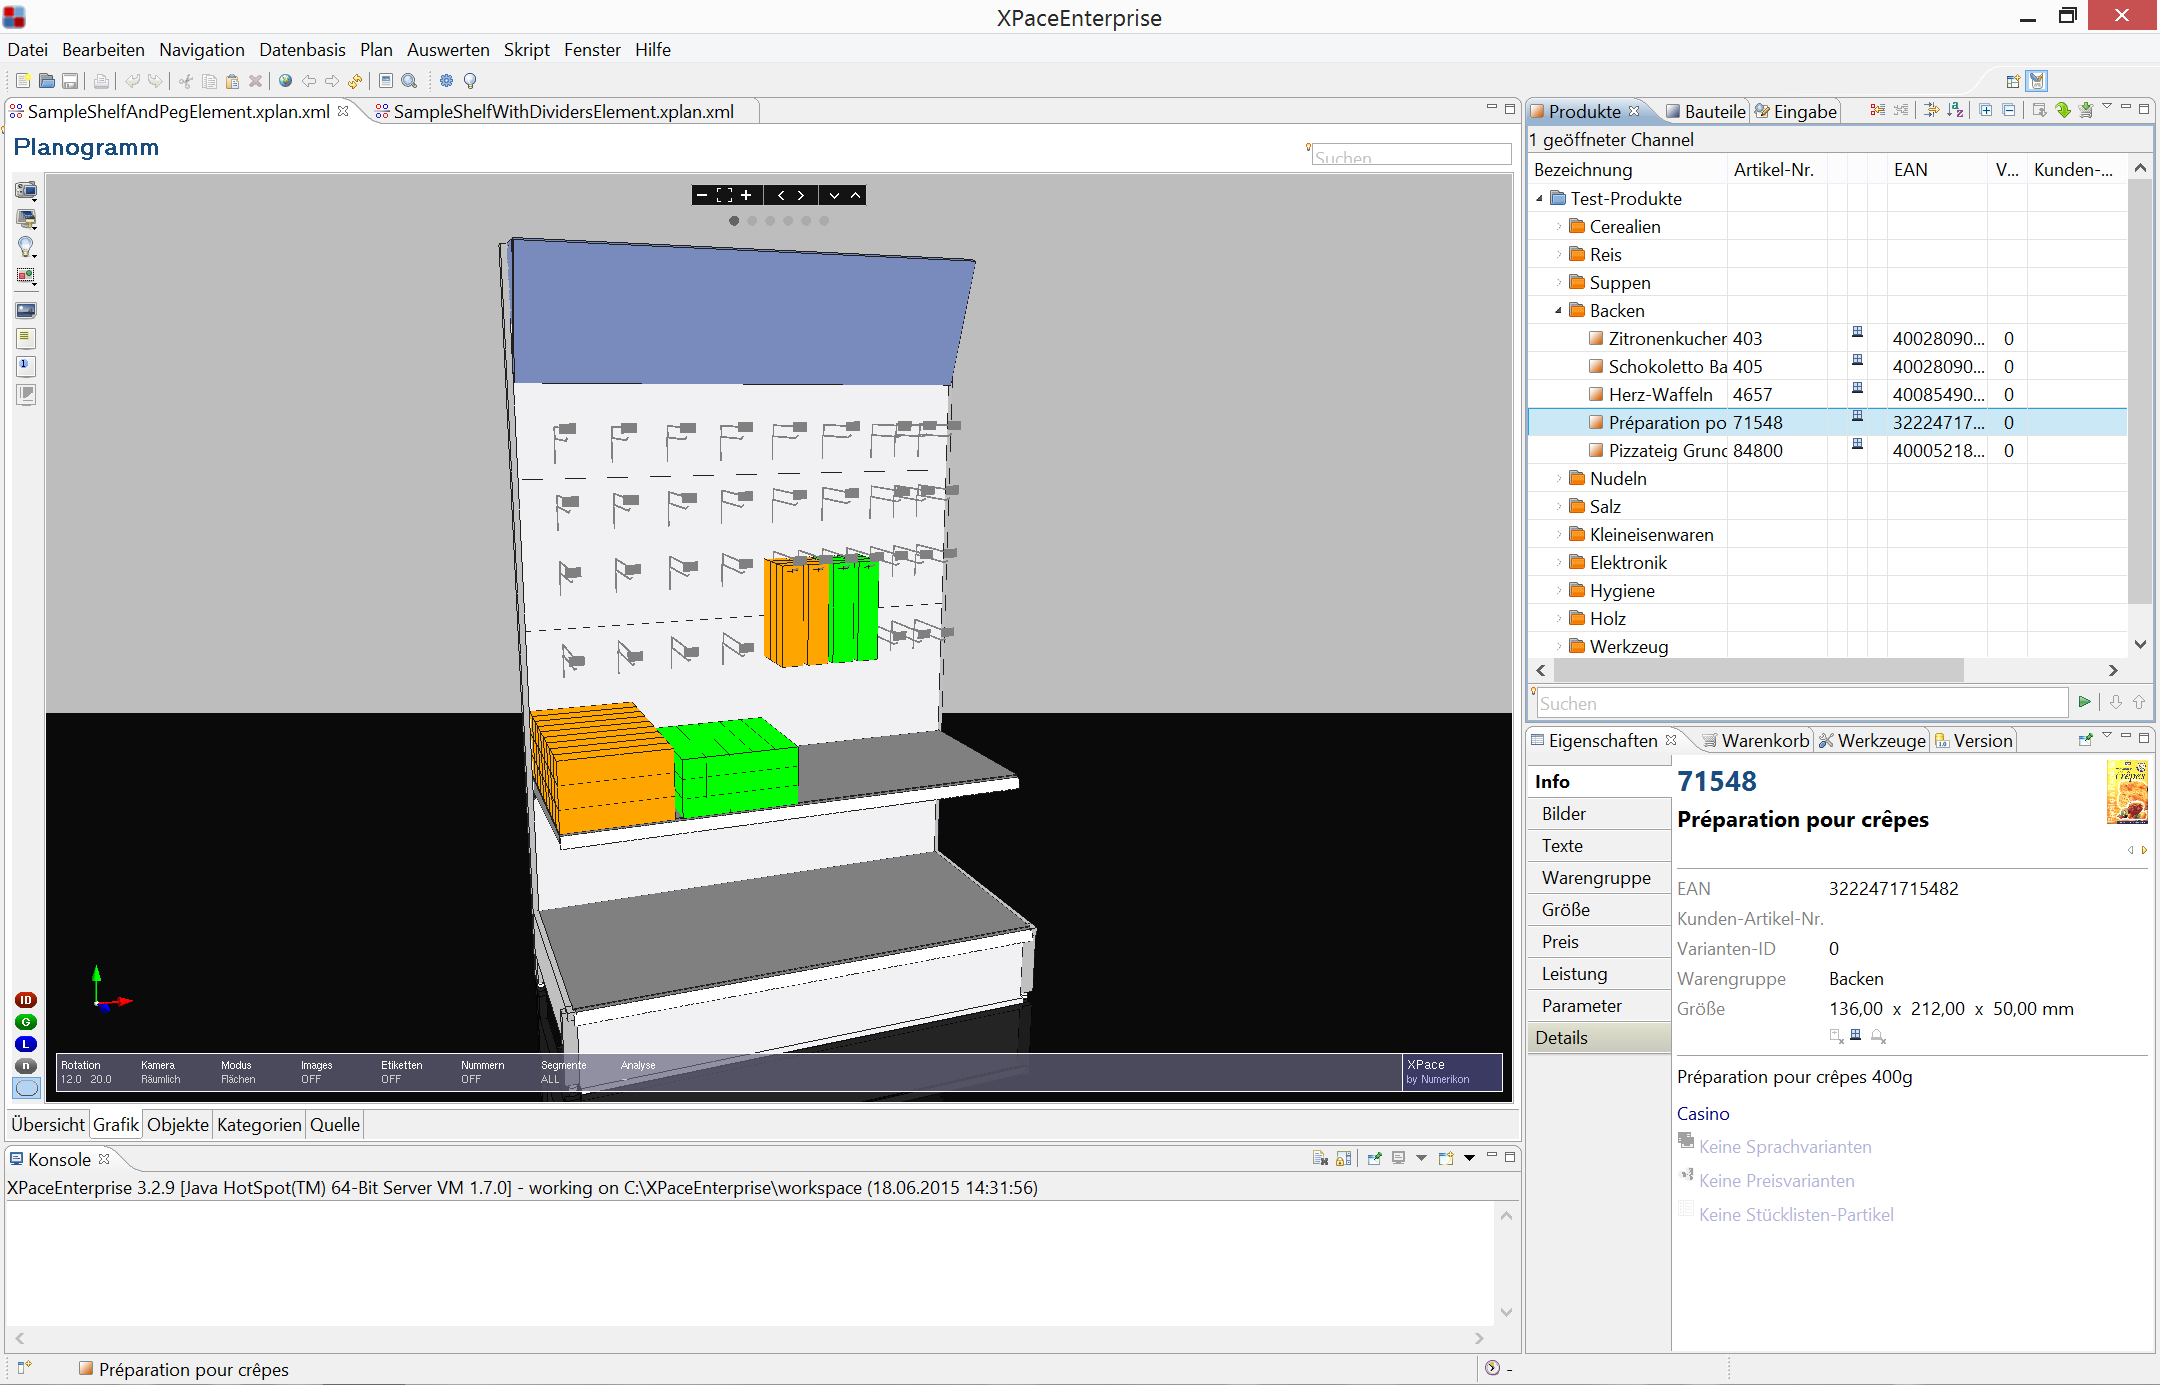
Screenshots


Reports