
As store space and shelf space are scarce and expensive, while the point-of-sale in the stationary specialist and retail trade is the decisive place for generating sales, shelf allocation needs to be very well planned and justified and regularly revised. A space management system provides the necessary functions and evaluation models for a practical shelf planning and an argumentation-strong shelf evaluation.
Contents
Spacemanagement combines the visual impression of the point-of-sale with the hard facts of key business figures. Beyond the mere positioning of products, synergy effects arise that would not be achievable with reporting in merchandise management or virtual reality presentations alone.
In the context of trade marketing, a space management system is
- planning aid
- optimizing tool
- basis for argumentation
in any internal and external communication.
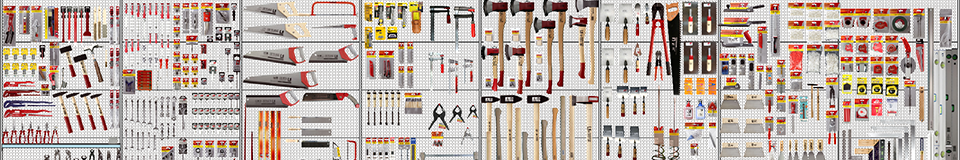
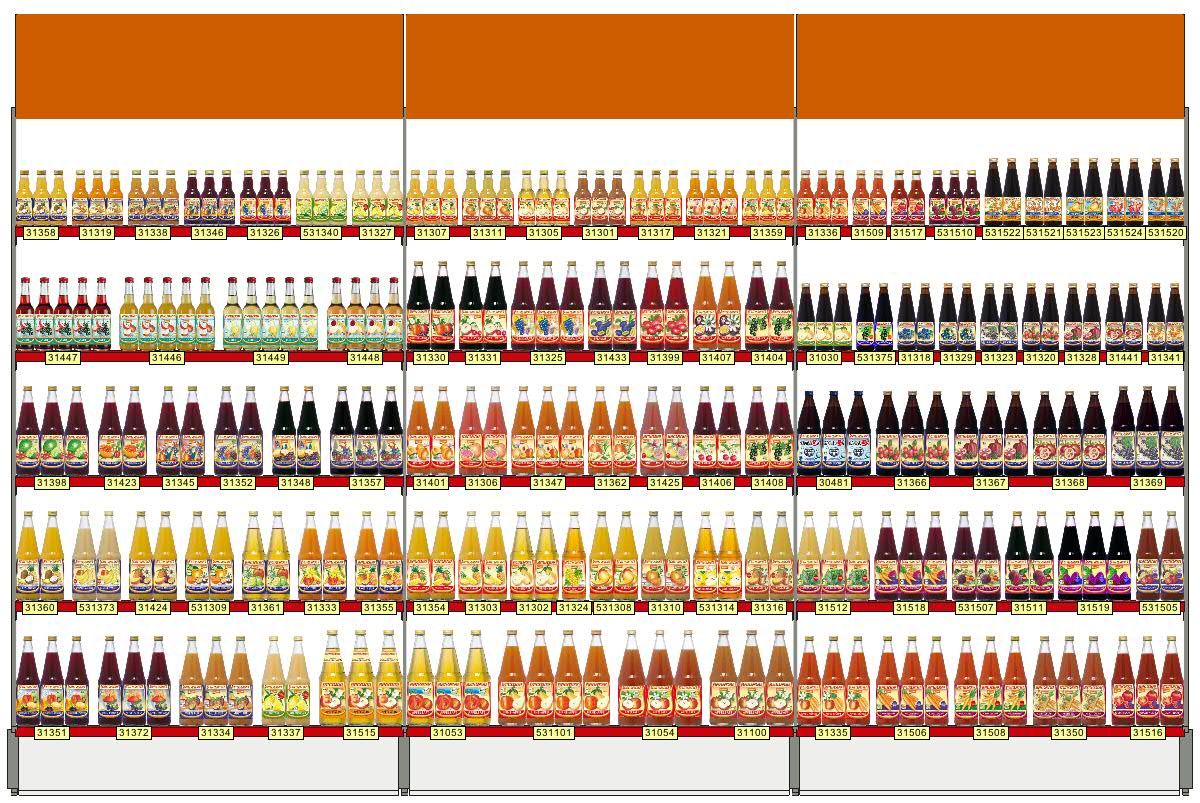
The room-related planning of a shelf takes place in the form of a planogram. A planogram contains all data of a planning for a point-of-sale in the sense of a single shelf, a shelf wall, a display or a shop. It defines the datasets of the placement as well as the 2D and 3D representation of the shelf.
Space management is divided into the substeps shelf planning, shelf revision, shelf analysis and optimization as well as provision of planograms.
Objectives and procedures
A space management strategy pursues the following goals
- Selection and presentation of a suitable product range
- Consideration of customer demand and customer expectations
- Return-on-investment, sales and earnings targets
- Optimization of stock quantities
- Reduction of handling costs
Some of these goals are in competition with each other and cannot all be achieved equally well. The task of space management is to achieve a balanced overall solution. The space management strategy can be used both for initial installations and for target/actual optimizations in the context of shelf-actual gathering and POS relaunches.
Shelf planning
The basic procedure of shelf planning is carried out in the following steps:
- Assembly of a racking scaffold from components
- Selection of articles from a product database
- Positioning and arranging articles on shelves: individual articles or groups of articles, manual or rule-based article selection, automatic or manual composition of articles on a target shelf
- Fixel properties define position sequences, alignments and anchor points
- Customize and modify product composition
- Shelf revision
An existing planogram is revised for the scenarios
- Changes to assortment and listing, introduction of new articles, discontinuation of older articles
- Seasonal changes and other adjustments to consumer behavior and customer expectations
- Price adjustments and adjustments to sales and earnings expectations
- Enlargement and reduction of available shelf space
- Shelf analysis and optimization
As part of a space management strategy, planograms and shelves are evaluated and revised with regard to key business figures with the aim of increasing sales and earnings and improving inventory management
- taking into account prices and conditions
- taking into account sales, turnover and earnings of previous periods and future expectations
- taking into account shelf zones
- while comparing actual and target status
- provision
The planogramming data is made available to the subsequent users by
- reporting: lists, tables, graphs
- exports, provision and passing on
- online provision
Data and data sources
The most important data on the input side is the product data: Products are the core elements of POS planning. The data on the shelf components and product carrying fixtures are also part of the input.
The planogram graphics, lists and reports, analyses and key figures are the most important data on the output side. Planogram deployment data is added in the form of HTML web pages, spreadsheets, and PDF reports.
Product data
The product data initially includes the article master data: Article number as primary key, article description and the dimensions of the product units, supplemented as required by categorisation data such as product group, price group, product family, assortment affiliation and manufacturer.
Logistical product data describe minima and maxima, gaps between handles, stacking and nesting dimensions of articles, packaging units, repackaging levels and target figures, as well as destinations and restrictions.
Item performance data are sales figures and turnover related to periods and markets. Together with price information on the purchasing and sales side, this data is used for evaluations, analyses and optimizations.
Product images and 3D models
Product images are a special form of product data. They are assigned to certain surfaces of the article geometry; the most important is the front side with the corresponding front image. The images are managed as independent image files to which the product records refer with a key or link.
Three-dimensional object models can be used as an option. This improves the visual presentation of complex product shapes, but increases the effort involved in recording or generating 3D geometric data.
Fixture data
Fixture data describe master data, dimensions and geometries of shelf components, fixels and displays.
Fixtures can be roughly divided into product carriers and non-material carriers. While their dimensions and geometries are given for both types, product carriers describe their behaviour when positioning and arranging products with additional properties. Fixtures are thus determined not only by their geometry, but also by their filling and positioning behavior.
Planograms
In planograms, the data of the components and articles used are combined with concrete positioning and filling. The space management program offers suitable, convenient functions for this; normally the 2D or 3D graphics editor will be used here.
All master and positioning data of the components and articles in a planogram are contained in the planogram file. Product images are managed as independent resources to which the data records in the planogram file refer. A planogram file can be passed on independently, but a representation with images requires access to the referenced image files (locally or online).
A distinction is made between the master data records and the loalization objects of products and components. Master data, dimensions, geometries and prices are included in the master data sets, coordinates, references and concrete quantities in the localisations. One or more localizations can belong to a root object.
Export data
Exported data can require many different data formats depending on its purpose, e.g. PNG, JPEG, TIFF or BMP for graphics, PDF or HTML for reports, XLS for tables.
Planning and positioning
In a planogram, the master data from product and component channels is transferred to concrete localization objects. First, a rack frame is assembled from constructive components. Products are then selected and positioned, filled and arranged on product carrier fixtures.
Articles are identified by their article number or EAN/UPC/GTIN code and placed on the product carriers individually or in groups, taking into account the available merchandising space.
Structural components
Fixtures differ in purely constructive elements (non-goods-carriers) and elements for goods positioning (goods-carriers). Product carriers require additional information that allow products to be placed and arranged in designated locations and in a specific manner, in particular an allocation type and merchandising space.
Products
Products define allowed allocation types and additional logistical information that is taken into account during positioning. Possible allocation types are
- hanging: on pegboard hooks or other holders
- standing, lying, stacked: on shelves, pallets, in chests and compartments
- loose, poured: in baskets and chutes
Positioning and arranging
Products are placed on product carriers, where they are assigned a position and filling and aligned appropriately. For this purpose, the suitable products are selected and assigned to the target product carrier. The product carrier applies its allocation properties and arranges the products accordingly.
Product selection is based on one of the following principles
- manually
- through search functions
- barcode-controlled
- based on a filter
- with a rule
The selection is transferred individually or in groups into a product positioning. Sequences, distances and alignments are applied automatically, invalid assignments are rejected.
Editing
All positionings can be edited and modified later. The space management program provides the corresponding functions for this purpose. Changes are made individually, in groups, controlled by rules or fully automated.
Evaluate, analyze and optimize
In space management, the return on investment (ROI) is considered in the form of a return on inventory investment (ROII): The products located on limited shelf space are related to the expected and achieved return.

The aim is to sell products and generate sales and earnings via the point-of-sale. Customer expectations should also be fulfilled in the best possible way. The products compete for available shelf space, whereby several optimization goals (maximization of sales, maximization of earnings, inventory management, capital commitment, product group competence, logistics) need to be considered simultaneously.
The space management program checks what value the current POS planning represents, what sales and earnings can be expected and whether the planned inventories are appropriate for sales. It uses performance data (sales figures, turnover, stock movements) and category considerations and determines corresponding key figures. Typical evaluation criteria are contact lines, speeds, delivery rates, area productivity and area profitability, which can be applied to individual articles, categories or the overall shelf.
The decisive factor is that – unlike other analysis tools in merchandise management systems, etc. – these evaluations are used as a basis for the evaluation, not only based on data sets, but also taking into account the (available and occupied) space. Therefore, the typical key figures are productivity, profitability and the contribution margin of the occupied area.
Analyses
Analyses are thematic evaluations of a planogram based on imported product performance data, business key figures and the current occupancy. The results of an analysis can be visualized as color highlighting on the planogram graphic. Analysis data can be exported graphically and alphanumerically.
An analysis requires the availability of the performance data of the positioned articles, e.g. sales and turnover figures, initial assembly and target quantities with reference to time.
Since the performance data of the articles are not always easily available, the analysis phase is optional, it can initially be ignored and implemented at a later date. On the other hand, the analysis phase is the area that is particularly suitable for optimizing sales, earnings and profitability and for controlling inventory ranges with regard to avoiding short sales on the one hand and excessive capital commitment of slow-moving articles on the other.
Typical analyses are:
- Sales and profit forecast
- Contact line analysis by product group and manufacturer
- Stock analysis with regard to supply, overstocking and understocking
- Stock assessment
- Cost-benefit analysis
- Relevance analysis
- Store space performance
- Net and gross shelf space evaluation
- Multi-item analysis and listing comparison
- Profit margin
- Highlighting
The results of an analysis are projected onto the planogram with color highlighting. Performant and critical product positioning is immediately visible.
Each analysis defines its own set of color ranges, each of which relates a partial aspect of the analysis results to the shelf. A legend establishes the relationship between colored zones and value ranges.
Deployment
The planning data developed in a planogram is not only used internally, but is also usually communicated externally, for example, to fitters, sales representatives, wholesale partners, stores, franchisees or customers. Paper-based communication channels (sending planogram graphics and lists by post) and simple online communication (sending PDFs by e-mail) can be used for this – but at the latest when a return channel is required, other communication and presentation channels should be considered.
A return channel is required if the field service or the branch or local partner wants to make changes to layouts and send them back to the head office. We recommend the use of a web-based online platform that provides planograms and reports, but which can also be used to upload changed planograms.
Particular attention must be paid to a structured and flexible organization of the planogram storage. This concerns the assignment of planograms
- to manufacturers and product groups
- to regions and customer groups
- for assortments and categories
- for time periods
- to market sizes
Reports, parts lists and layouts can be provided via a web interface, ensuring that all data is always up-to-date. The planning and reporting tool communicates bidirectionally with the web repository, providing both upload and download options.
Automating
Many processing steps and operations in shelf planning are repeated regularly. It makes sense to combine and automate processes into macros and program special function sequences as scripts.
Scripting can be used in many different ways, ranging from the automation of recurring workflows to programming your own planogram and positioning algorithms. Some typical scenarios:
- Automated reporting
- Creating a start configuration
- Bulk processing
- Planogram adjustment using balance lists
- Analysing, highlighting and export of analysis data
- Creating custom product arrangement
Extensions and adaptations
Although the space management program offers a complete range of functions for shelf planning and optimization, there may be custom requirements in special cases that cannot be adequately implemented with standard functions. Integration of special functions with individual algorithms and interfaces via an extension interface enables the software to implement those customizings as well.
Thus, the space management software is prepared and adaptable to special cases.
Links
- Axel Winkelmann: Anwendungssysteme im Handel (Enzyklopädie der Wirtschaftsinformatik)
- FG Informatik: Warenwirtschaftssysteme in der Lebensmittelindustrie (TU Berlin)